UNITED STATES
SECURITIES AND EXCHANGE COMMISSION
Washington, D.C. 20549
SCHEDULE 14A
Proxy Statement Pursuant to Section 14(a) of the Securities Exchange Act of 1934
Filed by the Registrant ý
Filed by a Partyparty other than the Registrant o
Check the appropriate box:
o Preliminary Proxy Statement
o Confidential, for Use of the Commission Only (as permitted by Rule 14a-6(e)(2))
ý Definitive Proxy Statement
o Definitive Additional Materials
o Soliciting Material under § 240.14a-12
Pool Corporation
(Name of Registrant as Specified in Itsits Charter)
(Name of Person(s) Filing Proxy Statement, if other than the Registrant)
Payment of Filing Fee (Check the appropriate box):
ý No fee requiredrequired.
o Fee computed on table below per Exchange Act Rules 14a-6(i)(1) and 0-11.
|
| |
| (1) | Title of each class of securities to which transaction applies: |
| | |
| (2) | Aggregate number of securities to which transaction applies: |
| | |
| (3) | Per unit price or other underlying value of transaction computed pursuant to Exchange Act Rule 0‑11 (set forth the amount on which the filing fee is calculated and state how it was determined): |
| | |
| (4) | Proposed maximum aggregate value of transaction: |
| | |
| (5) | Total fee paid: |
| | |
o Fee paid previously with preliminary materials.
o Check box if any part of the fee is offset as provided by Exchange Act Rule 0-11(a)(2) and identify the filing for which the offsetting fee was paid previously. Identify the previous filing by registration statement number, or the Form or Schedule and the date of its filing.
|
| |
| (1) | Amount Previously Paid: |
| | |
| (2) | Form, Schedule or Registration Statement No:No.: |
| | |
| (3) | Filing Party: |
| | |
| (4) | Date Filed: |
| | |
POOL CORPORATION
_____________________
NOTICE OF ANNUAL MEETING OF STOCKHOLDERS
Pool Corporation (the Company, we, us or our) will host its 20172019 annual meeting of stockholders (the Annual Meeting) on Tuesday,Wednesday, May 2, 2017,1, 2019, at 9:00 a.m., Central Time, at our corporate headquarters, located at 109 Northpark Boulevard, Covington, Louisiana 70433.
At the Annual Meeting, you will be asked to:
| |
| 1. | elect seveneight directors, each to serve a one-year term or until their successors have been elected and qualified; |
| |
| 2. | ratify the retention of Ernst & Young LLP, certified public accountants, as our independent registered public accounting firm for the 20172019 fiscal year; |
| |
| 3. | cast a non-binding advisory vote to approve the compensation of our named executive officers as disclosed in the attached Proxy Statement (the say-on-pay vote); and |
| |
| 4. | cast a non-binding advisory vote on the frequency of future say-on-pay votes (the frequency vote); and |
| |
5. | consider any other business which may properly arise at the Annual Meeting. |
The accompanying Proxy Statement describes the matters being voted on and contains other information relating to Pool Corporation.
The Board of Directors has set March 15, 201714, 2019 as the record date for the Annual Meeting. This means that only record owners of the Company’s common stock at the close of business on that date are entitled to notice of, and to vote at, the Annual Meeting and at any adjournment or postponement of the Annual Meeting.
By Order of the Board of Directors,
Jennifer M. Neil
Corporate Secretary
Covington, Louisiana
March 29, 201728, 2019
We urge each stockholder to promptlyEvery stockholder’s vote is important. Please sign, date and return the enclosed proxy card, or if applicable, to useauthorize your proxy by telephone or internet voting.via the internet. See “Frequently Asked Questions Regarding Attendance and Voting” for information about voting by telephone or internet.
POOL CORPORATION
TABLE OF CONTENTS
POOL CORPORATION
109 Northpark Boulevard
Covington, Louisiana 70433
PROXY STATEMENT
Frequently Asked Questions Regarding Attendance and Voting
Q: Why am I receiving these materials?
A: The Board of Directors (the Board) of Pool Corporation (the Company, we, us or our) is providing these proxy materials to you in connection with its solicitation of proxies for use at the 20172019 annual meeting of our stockholders (the Annual Meeting). Stockholders at the close of business on March 15, 2017,14, 2019, the record date, are entitled to vote at the Annual Meeting.
Q: Who may vote?
A: With respect to the election of directors, each stockholder is entitled to one vote for every share of common stock, $0.001 par value (Common Stock) owned on the record date for each position to be filled. For all other matters, each stockholder is entitled to one vote on each matter presented for each share of our Common Stock owned on the record date. On March 15, 2017,14, 2019, there were approximately 41,287,54539,599,011 shares of our Common Stock outstanding. This Proxy Statement is being mailed to stockholders on or about March 29, 2017.28, 2019.
Q: When and where will the Annual Meeting be held?
A: The Annual Meeting will be held on Tuesday,Wednesday, May 2, 2017,1, 2019, at 9:00 a.m., Central Time, at our corporate headquarters, located at 109 Northpark Boulevard, Covington, Louisiana 70433.
Q: How can I obtain directions to the Annual Meeting?
A: To obtain directions to the Annual Meeting, please contact Investor Relations at (985) 892-5521.
Q: What proposals will be voted upon at the Annual Meeting?
A: At the Annual Meeting, you will be asked to:
| |
| (1) | elect seveneight directors to the Board of Directors, each to serve a one-year term or until their successors have been elected and qualified; |
| |
| (2) | ratify the retention of Ernst &Young LLP as our independent registered public accounting firm for the 20172019 fiscal year; and |
| |
| (3) | cast a non-binding advisory vote to approve the compensation of our named executive officers as disclosed in this Proxy Statement (the say-on-pay vote); and |
| |
(4) | cast a non-binding advisory vote on the frequency of future say-on-pay votes (the frequency vote). |
The Board does not know of any additional matters to be presented at our Annual Meeting other than those described in this Proxy Statement.
Q: What are the Board’s voting recommendations?
A: The Board unanimously recommends that you vote your shares FOR the election of each of the director nominees and FOR proposals 2 and 3 described above. With respect to the frequency vote, the Board unanimously recommends that you vote your shares to hold future say-on-pay votes every year.
Q: How do I vote?
A: If you are a holder of record (that is, if your shares are registered in your own name with our transfer agent), you may vote using the enclosed proxy card. You can also vote by telephone or the internet. Voting instructions are provided on the proxy card included in the proxy materials.
If you are a street name holder (that is, if you hold your shares through a bank, broker or other holder of record), you must vote in accordance with the voting instruction form provided by your bank, broker or other holder of record. The availability of telephone or internet voting will depend upon the voting process of your bank, broker or other holder of record.
If you come to the Annual Meeting, you can, of course, vote in person. If you are a street name holder and wish to vote at the meeting, you must first obtain a proxy from your bank, broker or other holder of record authorizing you to vote.
Q: How many votes must be represented to hold the Annual Meeting?
A: In order to carry on the business of the Annual Meeting, a quorum must be present. This means at least a majority of the outstanding shares eligible to vote must be represented at the Annual Meeting, either by proxy or in person. If you submit your proxy instructions or if you attend the Annual Meeting in person, your shares will be counted for the purpose of determining a quorum, even if you abstain from voting on some or all matters introduced at the Annual Meeting. Also, if you hold your shares in street name, your shares will be counted in determining a quorum if your bank, broker bank or other holder of record votes your shares on any matter.
Q: Could other matters be decided at the Annual Meeting?
A: We are not aware of any matters to be presented other than those described in this Proxy Statement. By signing and returning a proxy card, however, you will give to the persons named as proxies discretionary voting authority with respect to any other matter that may properly come before the Annual Meeting, and they intend to vote on any such matter in accordance with their best judgment.
Q: What if I do not indicate my voting instructions for one or more of the matters on my proxy card?
A: If you execute and return your proxy but do not give voting instructions, your shares will be voted as recommended by the Board. This means that unless your proxy is otherwise marked, properly executed proxies will be voted FOR the election of each of the director nominees and FOR proposals 2 and 3 (the ratification of the independent registered public accounting firm for fiscal year 20172019 and the say-on-pay vote) and FOR an annual say-on-pay vote..
Q: What happens if I do not return my proxy? What is discretionary voting authority, and what is a broker non-vote?
A: If you are a holder of record and do not return a proxy, your shares will not be voted.
If you are a street name holder and do not provide voting instructions to your broker, your shares may be voted on any matter on which your broker has discretionary authority to vote. Under the rules of the New York Stock Exchange (NYSE), brokers generally have discretionary authority to vote on “routine” matters but not on “non-routine” matters. A “broker non-vote” occurs when a broker holding shares for a street name holder returns a valid proxy, but does not vote on a particular proposal because it does not have discretionary authority to vote on the matter and has not received voting instructions from the stockholder for whom it is holding shares. Broker non‑votes will be treated as present for purposes of determining the existence of a quorum at the Annual Meeting.
The ratification of the appointment of the independent registered public accounting firm is considered a routine matter; the remaining proposals listed in this Proxy Statement (the election of directors the say-on-pay vote and the frequencysay-on-pay vote) are classified as non‑routine matters under the NYSE rules. Therefore, if you are a street name holder and do not provide voting instructions to your broker, your broker may only cast a vote with regard to the ratification of the appointment of the independent registered public accounting firm.
Q: What is the vote required, and how will my vote be counted, to elect the director nominees and to approve the other proposals discussed in this proxy statement?
|
| | | | | | | | |
| Proposal | | Voting Options | | Vote Required to Adopt the Proposal | | Effect of Abstentions | | Effect of Broker Non-Votes |
No. 1 - Elect seveneight directors | | For, against or abstain on each director nominee | | Affirmative vote of a majority of the votes cast | | N/A | | No effect |
| | | | | | | | | |
| No. 2 - Ratify retention of independent registered public accounting firm | | For, against or abstain | | Affirmative vote of a majority of the shares of Common Stock present in person or by proxy and entitled to vote | | Treated as votes against | | N/A |
| | | | | | | | | |
| No. 3 - Say-on-pay vote | | For, against, or abstain | | Affirmative vote of a majority of the shares of Common Stock present in person or by proxy and entitled to vote | | Treated as votes against | | No effect |
| | | | | | | | |
No. 4 - Frequency vote | | Every year, every two years, every three years or abstain | | The frequency receiving the greatest number of votes - every year, every two years or every three years - will be the frequency that stockholders approve | | N/A | | No effect |
In uncontested elections, our directors are elected by the affirmative vote of the holders of a majority of the shares of our Common Stock voted. In contested elections (where the number of director nominees exceeds the number of directors to be elected), our directors are elected by a plurality of shares of our Common Stock voted. Under our Bylaws, all other matters require the affirmative vote of the holders of a majority of the shares of our Common Stock present in person or by proxy and entitled to vote, except as otherwise provided by statute, our Certificate of Incorporation or our Bylaws.
Q: Can I change or revoke my proxy?
A: Yes. To change or revoke your proxy at any time before the shares are voted at the Annual Meeting, you must either:
| |
| a) | mail (i) a new proxy card with a later date or (ii) a written revocation addressed to: |
Pool Corporation
Jennifer M. Neil, Corporate Secretary
109 Northpark Boulevard
Covington, LA 70433-5001
or
| |
| b) | attend the Annual Meeting and vote in person. |
Q: Who will pay the expenses incurred in connection with the solicitation of my vote?
A: We pay the cost of preparing proxy materials and soliciting your vote. We will, upon request, reimburse brokers and other nominees for the cost of mailing materials to beneficial owners. Some of our employees, who will receive no additional compensation, may solicit proxies by telephone, facsimile or electronic mail. We also pay all Annual Meeting expenses.
Q: What happens if the Annual Meeting is postponed or adjourned?
A: Unless a new record date is fixed, your proxy will still be good and may be voted at the postponed or adjourned Annual Meeting. You will still be able to change or revoke your proxy at any time until it is voted.
Important notice regarding the availability of proxy materials for the Annual Meeting to be held on May 2, 2017:1, 2019:
The Company’s 2019 Proxy Statement and Annual Report to Stockholders for the fiscal year ended December 31, 20162018 are available at http://ir.poolcorp.com/Proxy.
ELECTION OF DIRECTORS
(Proposal 1)
General
Our Bylaws provide that the size of our Board may be increased or decreased from time to time by resolution of the Board. On March 1, 2017, Wilson B. Sexton notifiedOctober 30, 2018, the Board that he intendsincreased the size of the Board to retire ateight members and upon recommendation of the end of his term,Nominating and as such, does not intend to stand for reelection at our 2017 Annual Meeting. Corporate Governance Committee, appointed Debra S. Oler.
The Board, upon the recommendation of the Nominating and Corporate Governance Committee, has nominated each of our remaining seveneight current directors to serve another one-year termterm. Other than Ms. Oler, each of the nominees was previously elected a director of the Company by our stockholders, and currently intends to reduce its size to seven members following the Annual Meeting. Eacheach of the nominees has indicated his or her intention to serve if elected. However, if any director nominee is unable or unwilling to take office at the Annual Meeting, your proxy may be voted in favor of another person or other persons nominated by the Board. Once elected, each director will hold office until his or her successor has been elected and qualified or until the director’s earlier resignation or removal.
Our Bylaws as amended, include a majority voting standard in uncontested director elections. This means that if the number of shares voted for the election of any sitting director is less than the number of votes withheld or against election with respect to that director, that director must submit a letter to the Board offering to resign. The Board, after considering the recommendation of the Nominating and Corporate Governance Committee, must make a decision whether to accept, reject or take other action with respect to the resignation within 90 days from certification of the election results.
Information about our Director Nominees
Below is biographical information about each of our director nominees including information regarding his tenure as a director, his business experience and qualifications, his education, and other company directorships. The summaries are not comprehensive, but describe the primary experiences, attributes and skills that led the Nominating and Corporate Governance Committee and our Board to determine that these individuals should serve as directors of our Company. In addition to the qualifications referred to below, we believe each individual has a reputation for integrity, honesty, and high ethical standards and has demonstrated sound business judgment.
Andrew W. Code (58)(60)
Director since: 1993
Business experienceexperience:
Mr. Code was a founding partner of CHS Capital, a Chicago-based private equity investment firm with five funds totaling over $2.7 billion in assets from 1998 until his retirement in 2012. Since 2012, he has focused on personal and philanthropic investments both individually and in association with a multi-family office.
Other directorshipsdirectorships:
Mr. Code serves as a director of Legacy Acquisition Corp., an acquisition company focused on consumer packaged goods and other consumables. Mr. Code also serves as a member of various private, profit and non-profit boards of directors, including the University of Iowa Foundation, where he serves as chair of the investment committee, Sun Trading Company, Resource Land Holdings, Creation Investments, CapX Partners,Pure Foods, Golden Bake, LaSalle Capital, Quality Control Corporation, Chicago Fellowship and ProSteel Security Products.Boat House Holdings LLC.
Other qualificationsqualifications:
Mr. Code holds a Bachelor of Arts and a Master of Business Administration from the University of Iowa. Among other qualifications, Mr. Code brings to the Board extensive financial expertise, many years of senior leadership and business development experience, and significant acquisition and initial public offering experience.
Areas of experience include:
| |
▪ | Mergers and acquisitions |
Finance
Mergers and acquisitions
Strategic opportunities
Management
Compensation
Timothy M. Graven (65)(67)
Director sincesince: : 2015
Business experience:
Mr. Graven is a co-founder and managing member of Triad Investment Company, LLC, a private investment company, since 1994. From 1990 to 1994, he served as president, chief operating officer and director of Steel Technologies, Inc., a former NASDAQ‑Nasdaq‑listed steel processing company, where he also served in various positions including executive vice president, chief financial officer, vice president of finance and corporate controller from 1979 to 1990.
Other directorships:
From 1993 to 2008, Mr. Graven was a director of Performance Food Group Company (PFG), a food servicefoodservice distribution company, serving on its audit, compensation, and corporate governance committees. From 1981 to 1994, he served as a director of Steel Technologies, Inc. and from 1988 to 1994 as a director of Processing Technologies, Inc., a joint venture of LTV Steel, Mitsui Steel Development Company and Steel Technologies, Inc. From 1988 to 1992, he served as a director of Soltec, Inc., a Kentucky manufacturing company.
Other qualifications:
Mr. Graven received a Bachelor of Science from Murray State University and is a certified public accountant. Among other qualifications, Mr. Graven brings to the Board broad leadership and corporate governance experience as well as comprehensive experience in financial and risk management matters.
Areas of experience include:
Finance
Management
Compensation
Corporate governance
Audit
Debra S. Oler (64)
Director since: October 30, 2018
Business experience:
Since 2017, Ms. Oler has served as senior vice president/president, North American sales and service of W.W. Grainger, Inc. (Grainger), a distributor of maintenance, repair and operating supplies used by businesses and institutions. Since joining Grainger as regional sales vice president in 2002, Ms. Oler has held several roles with increasing responsibility. Prior to joining Grainger, Ms. Oler gained extensive sales and leadership experience with Alliant FoodService, Inc. from 1996 to 2002, Kraft Foods from 1986 to 1996 and I. Feldman & Company from 1973 to 1986.
Other qualifications:
Ms. Oler holds a Bachelor of Science from the University of Maryland. Among other qualifications, Ms. Oler brings to the Board extensive leadership and general management experience, a strong history of strategic go-to-market and sales team development, a proven track record of driving revenue growth, and significant customer service experience.
Areas of experience include:
Business development
Management
Marketing
Finance
Distribution knowledge
Manuel J. Perez de la Mesa (60)(62)
Director and chief executive officer sincesince: : 2001
Business experience:
Mr. Perez de la Mesa has served as our president since 1999 and waschief executive officer from 2001 until his retirement at the end of 2018; he served as our president and chief operating officer from 1999 to 2001. Prior to joiningleading Pool Corp,Corporation, he gained extensive general, financial and operations management experience with Watsco, Inc. from 1994 to 1999, Fresh Del Monte Produce B.V. from 1987 to 1994, International Business Machines Corp. from 1982 to 1987, and Sea‑Land Service Inc./R.J. Reynolds, Inc. from 1977 to 1982.
Other directorships:
Mr. Perez de la Mesa is a director of Hamilton HoldCo, LLC, the U.S. subsidiary of the Reece Group, a leading distributor of plumbing, waterworks and HVAC-R products in Australia and New Zealand, and AEA TCB Holdings LP, a distributor of glass and plastic rigid packaging in North America. He previously served as a director of ARC Document Solutions, a leading reprographics company, and serves on its compensation and audit committees.company.
Other qualifications:
Mr. Perez de la Mesa holds a Bachelor of Business Administration from Florida International University and a Master of Business Administration from St. John’s University. Among other qualifications, Mr. Perez de la Mesa brings to the Board extensive management experience, over 1520 years of industry knowledge, a broad strategic vision for the Company, and a strong financial acumen.
Areas of experience include:
| |
▪ | International operations |
| |
▪ | Management Strategic planning International operations Finance Industry knowledge |
Harlan F. Seymour (67)(69)
Director since:since: 2003
Business experience:
Since 2000, Mr. Seymour conducts personal investments in both public and private companies and provides business advisory services through HFS LLC, particularly in the area of strategic planning services for companies in a wide variety of industries. He previously served as executive vice president of Envoy Corporation, a publicly traded provider of EDI and transaction processing services for the healthcare market, from 1997 to 1999 when it merged with Quintiles Transnational. Mr. Seymour has previous general, financial and operations management experience with Jefferson Capital Partners from 1996 to 1997, Trigon Blue Cross Blue Shield from 1994 to 1996, and First Financial Management Corporation from 1983 to 1994, serving from 1990 to 1994 as president and CEOchief executive officer of its subsidiary, First Health Services Corporation and previously as senior vice president, corporate development.
Other directorships:
Mr. Seymour serves as a member of various private boards of directors, including Rx Innovation, a company that provides technology solutions to pharmacies and utilizes pharmacy transactions data to improve patient outcomes and the advisory board of Calvert Street Capital Partners, a private equity firm. He was previously a director of Envoy Corporation and chairman of ACI Worldwide, Inc. (ACI), a global provider of software for electronic payments and electronic commerce.
Other qualifications:
Mr. Seymour earned a Bachelor of Arts from the University of Missouri and a Master of Business Administration from Keller Graduate School of Management. Among other qualifications, Mr. Seymour brings to the Board senior leadership experience, information technology knowledge, strategic planning, operationsoperating and acquisition expertise.
Areas of experience include:
Strategic planning
Business development
Operations
Information technology
Finance
Robert C. Sledd (64)(66)
Director sincesince: : 1996
Business experience:
Since 2001, Mr. Sledd is the managing partner of Pinnacle Ventures, LLC, a venture capital firm, and Sledd Properties, LLC, an investment company. He previously served as CEOchief executive officer of PFG from 1987 to 2001 and from 2004 to 2006.
Other directorships:
Mr. Sledd is a directorthe chairman of Owens and& Minor, Inc., a distributor of medical and surgical supplies, chairs its compensation and benefits committee, and serves on its governance and nominating committee and its executive committee. Hesupplies; he is also a director of Universal Corporation, a diversified agriculture business, and serves on its audit, finance and pension investment committees. Mr. Sledd was chairman of PFG from 1995 to 2008 and a director from 1987 to 2008.
Other qualifications:
Mr. Sledd graduated from the University of Tennessee with a Bachelor of Science in Business Administration. Among other qualifications, he brings to the Board executive leadership experience, including his past service as a CEOchief executive officer of a public company, along with extensive strategic planning, brand marketing experience and financial expertise.
Areas of experience include:
| |
▪ | Finance Operations Marketing Business development Strategic planning |
John E. Stokely (64)(66)
Director sincesince:: 2000
Lead independent director since: 2003
Chairman since: 2017
Business experience:
From 1996 to 1999 Mr. Stokely served as president, CEOchief executive officer and chairman of Richfood Holdings, Inc., a regional Fortune 500 wholesale food distributor and operator of retail grocery stores prior to its acquisition by SuperValu Inc.
Other directorships:
Mr. Stokely is a director of Malibu Boats, Inc., a manufacturer of performance sports boats, and serves on its audit committee and nominating and governance committee. He was previously a director of O’Charley’s Inc., a national restaurant chain, Nash Finch Company, a wholesale food distributor, PFG, Imperial Sugar Company, and ACI.
Other qualifications:
Mr. Stokely holds a Bachelor of Arts from the University of Tennessee. Among other qualifications, he brings to the Board experience in providing strategic, financial, and risk management advice to companies engaged in a variety of industries, unique strategic insight, distribution and retail expertise and extensive senior leadership experience. Additionally, Mr. Stokely’s previous experience as CEOchief executive officer of Richfood Holdings, Inc. afforded him with significant acquisition experience.
Areas of experience include:
Finance
Management
Operations
Corporate governance
Distribution
David G. Whalen (59)(61)
Director sincesince: : 2015
Business experience:
From 1999 to 2014, Mr. Whalen served as the president and CEOchief executive officer of the A.T. Cross Company (subsequently Costa Inc.), a global manufacturer offrom 1999 to 2014 when the company was sold. A.T. Cross manufactured and marketed writing instruments and personal accessories including writing instruments under the Cross brand name and premium sunglasses under the Costa brand name. He acquired extensive general, marketing, acquisition, operations and international management experienceFrom 1991 to 1999, Mr. Whalen held various senior positions with Bausch & Lomb Inc. from 1991 to 1999 serving in various positions, including corporate vice president, president North American eyewearEurope, Middle East, and Africa division and president Europe, Middle East, Africa division. He further gained general, marketing, strategic and finance experienceNorth America Ray-Ban Division. Earlier in his career, Mr. Whalen was vice president business development with G. Heileman Brewing Company from 1989 to 1991 serving as vice president business development and witha consultant for Booz Allen Hamilton as a marketing associate from 1986 to 1988.Hamilton.
Other directorships:
Mr. Whalen serves as a director of Delta Apparel Inc., an international apparel design, marketing, manufacturing and sourcing company, and is a member of its corporate governance and compensation committees. Mr. Whalen previously served as a director of Phoenix Footwear Group, Inc. and Delta Apparel, Inc.; he was previously a director of A.T. Cross Company.
Other qualifications:
Mr. Whalen graduated from Trinity College with a Bachelor of Arts with honors, and he received a Master of Business Administration from the University of Chicago. Among other qualifications, Mr. Whalen brings to the Board background in developing and implementing marketing, operations and financeoperating strategies for global companies, engaged in a variety of industries, distribution and retail expertise, and extensive senior leadership experience in the United States and abroad.experience. Additionally, Mr. Whalen’s previous success engineering a major restructuring as well as identifying and integrating a number of acquisitions affordaffords him with unique strategic and operational insight.
Areas of experience include:
| |
▪ | Mergers and acquisitions |
| |
▪ | International operations |
Marketing
Finance
Mergers and acquisitions
International operations
Strategic planning
The Board of Directors unanimously recommends that our stockholders vote FOR the election of each of the director nominees.
Our Nominating and Corporate Governance Committee recommended to our full Board of Directors the foregoing nominees, and our Board has nominated them for election by our stockholders. At least annually, our Nominating and Corporate Governance Committee evaluates the effectiveness of the operation of our Board and Board committees and reviews the appropriateness of the composition and size of our Board and Board committees. In considering potential nominees, our Nominating and Corporate Governance Committee looks for personscandidates with the highest personal and professional ethics, integrity and values, who can commit themselves to representing the long-term interests of our stockholders. Nominees must also have an inquisitive and objective perspective, practical wisdom and mature judgment. Nominees must be willing to devote sufficient time to carrying out their duties and responsibilities effectively and should be committed to serving on our Board for an extended period of time.
In reviewing the composition of our Board and potential nominees, our Nominating and Corporate Governance Committee also considers the director independence and committee requirements of The NASDAQNasdaq Stock Market LLC (NASDAQ)(Nasdaq) listing rules and all legal requirements. Our Board seeks independent directors with a broad diversity of experience, professions, skills, geographic representation and backgrounds that will enhance the quality of the Board’s deliberations and decisions. Our Nominating and Corporate Governance Committee does not assign specific weights to particular criterion and no particular criterion is necessarily applicable to all prospective nominees. Prospective nominees are not discriminated against on the basis of gender, age, race, religion, national origin, sexual orientation, disability or any other basis proscribed by law.
Our Nominating and Corporate Governance Committee and Board believe the nominees fulfill the criteria described above. In addition, the Board has determined that sixseven of our seveneight director nominees (including all committee members) are independent under NASDAQNasdaq listing rules. All four current members of our Audit Committee are “audit committee financial experts,” as defined by the Securities and Exchange Commission (SEC) rules. In addition to these attributes, each of the nominees has a strong and unique background and experience which led our Nominating and Corporate Governance Committee and Board to conclude that he or she should serve as a director of our Company. We describe these qualifications individually for each nominee above.
Our Company has grown rapidly through internal growth and acquisitions to become the world’s largest wholesale distributor of swimming pool supplies, equipment and related leisure products and one of the top three distributors of irrigation and landscape products in the United States. We currently operate in 39 states, one U.S. territory and 1112 foreign countries. Accordingly, our nominees have experience in a variety of areas important to our Company, such as managing and overseeing large public and private companies, corporate governance and executive compensation, strategic planning, mergers and acquisitions, financing growing businesses, international operations, information technology and marketing, and experience in our industry. Our Nominating and Corporate Governance Committee and Board believe that these nominees together provide us with the range and depth of experience and capabilities needed to oversee the management of our Company.
Director Independence
To be considered independent under the listing rules of NASDAQ,Nasdaq, directors must be free from any relationship with management or the Company, which, in the opinion of the Board, would interfere with the exercise of independent judgment. The Board has determined that sixeach of our seven director nominees - Messrs. Code, Graven, Seymour, Sledd, Stokely and Whalen - meetcurrent directors, other than Mr. Perez de la Mesa, meets the definition of an independent director as defined by NASDAQNasdaq listing rules. The Board’s independent directors regularly meet in executive session (without management present) at each Board and committee meeting.
Board Leadership Structure and Lead Independent Director
The principal responsibility of the chief executive officer (CEO) is to manage the business. The principal responsibilities of the Board are to represent the Company’s stockholders and manage the operations of the Board and that of its committees.
Mr. Stokely currently serves as the Board’s lead independent director. Our lead independent director’schairman. His responsibilities in this capacity include the following:
| |
| ▪ | assign tasks to the Board’s committees; |
| |
| ▪ | determine the appropriate schedule of Board meetings after consultation with our CEO and other Board members; |
| |
| ▪ | consult with our CEO and other Board members on the agenda of the Board; |
| |
| ▪ | assess the quality, quantity, and timeliness of the flow of information from management to the Board; |
| |
| ▪ | direct the retention of consultants who report directly to the Board; |
| |
| ▪ | coordinate with the chairman of the Nominating and Corporate Governance Committee to oversee compliance with and implementation of corporate governance policies; |
| |
| ▪ | coordinate, develop the agenda for, and moderate executive sessions of the Board’s independent directors; |
| |
| ▪ | assist the chairman of the Compensation Committee in his evaluation of our CEO’s performance; and |
| |
| ▪ | perform such other functions as the Board may direct. |
On March 1, 2017, our chairman Mr. Sexton notified the Board that he intends to retire at the end of his term, and as such, does not intend to stand for reelection at our 2017 Annual Meeting. The Board plans to designate a new chairman at the Annual Meeting.
Director Attendance at Meetings
Our Board held sixfive meetings in the 20162018 fiscal year. As stated in our Corporate Governance Guidelines,, we expect directors to attend Board meetings and meetings of the Board committees on which they serve. In the 20162018 fiscal year, each of our incumbent directors attended 75% or more of the total number of Board meetings and meetings of the Board committees on which hethey served.
We encourage each member of our Board to attend the annual meeting, and all of our directors in office at the time attended the 20162018 annual meeting.
Board’s Role in Risk Oversight and Assessment
Our employees, managers and officers conduct our business under the direction of our CEO and the oversight of our Board to enhance our long-term value for our stockholders. The core responsibility of our Board is to exercise its fiduciary duty to act in the best interests of our Company and our stockholders. In discharging this obligation, our Board and committees perform a number of specific functions, including risk assessment, review and oversight. While management is responsible for the day-to-day management of risk, our Board is responsible for oversight of our risk management programs, ensuring that an appropriate culture of risk management exists within the Company and assisting management in addressing specific risks, such as strategic risks, financial risks, regulatory risks and operational risks.
Our Board’s objective is to have systems and processes in place that bring material risks facing our Company to the Board’s attention and permit the Board to effectively oversee the management of these risks. As reflected in our Code of Business Conduct and Ethics, our Board seeks to establish a “tone at the top” communicating our Board’s strong commitment to ethical behavior and compliance with the law. In furtherance of these goals, our Board regularly includes agenda items at its meetings relating to its risk oversight obligations and meets with various members of management on a range of topics, including corporate governance and regulatory obligations, disaster recovery and business continuity planning, succession planning, safety and risk management, insurance, and operations. Our Board also sets and regularly reviews quantitative and qualitative authority levels for management. Further, our Board oversees the strategic direction of our Company, and in doing so considers the potential rewards and risks of our Company’s business opportunities and challenges, and monitors the development and management of risks that may impact our strategic goals.
While risk oversight is a full Board responsibility, we also empower our various Board committees to address risk oversight in their respective areas and regularly report on their activities to our full Board. For example, our Strategic Planning Committee routinely reviews with management external and internal risks that may impact our strategic goals and our Compensation Committee assesses risks related to compensation. Our Audit Committee regularly reviews our disclosure controls and procedures and internal control over financial reporting, our Code of Business Conduct and Ethics, and other legal and regulatory matters affecting our Company, including compliance policies. Our Audit Committee also discusses our major financial risk exposures and steps management has taken to monitor and control such exposures, including our risk assessment and risk management policies. The Audit Committee also assists our Board in reviewing our cybersecurity risk with management. Our director of internal audit reports to and regularly meets in executive session with our Audit Committee.
Compensation-Related Risk
Our Compensation Committee assesses risks associated with our compensation policies and practices. We do not believe that our compensation policies or practices are reasonably likely to have a material adverse effect on our Company. While risk taking is a necessary part of growing a business, our compensation philosophy is focused on aligning compensation with the long-term interests of our stockholders as opposed to rewarding short-term management decisions that could pose long-term risks. For example:
| |
| ▪ | our annual cash award programs are capped for all members of senior management, including our Named Executive Officers (NEOs); |
| |
| ▪ | our Share Ownership Guidelines require our NEOs to hold Company stock; |
| |
| ▪ | we maintain a clawback policy for executive compensation; |
| |
| ▪ | our Insider Trading Policy prohibits hedging, pledging or monetization transactions involving our stock; |
| |
| ▪ | our long-term equity-based compensation cliff vests over a period of three to five years for all management recipients; and |
| |
| ▪ | beginning with 2016 grants, restricted stock awards contain performance-based criteria in addition to the time‑based vesting criteria discussed above. |
Moreover, equity awards are granted annually, which means executives always have unvested awards that could significantly decrease in value if our business is not managed for the long-term.long term.
Access to Management and Employees
Directors have full and unrestricted access to our management and employees. Additionally, key members of management attend Board meetings from time to time to present information about the results, plans and operations within their areas of responsibility.
Communications with the Board
Stockholders and other interested parties may communicate with the members of our Board by mail addressed to the full Board, a specific member of the Board or to a particular committee of the Board at 109 Northpark Boulevard, Covington, Louisiana 70433. Communications are distributed to the Board, or to a specific member of the Board, as appropriate, depending on the facts and circumstances outlined in the communication. In that regard, the Board has requested that certain items that are unrelated to the duties and responsibilities of the Board be excluded, such as junk mail, mass mailings, resumes and other forms of job inquiries and business solicitations or advertisements. In addition, material that is unduly hostile, threatening, illegal or similarly unsuitable may be excluded.
Code of Ethics
We have adopted a Code of Business Conduct and Ethics that applies to our employees, officers (including our principal executive officer, principal financial officer and principal accounting officer) and directors. Our Code of Business Conduct and Ethics is posted on our website at www.poolcorp.com and can also be obtained free of charge by sending a request to our corporate secretary at 109 Northpark Boulevard, Covington, Louisiana 70433. As permitted by SEC and NASDAQNasdaq rules, we intend to satisfy the disclosure requirement regarding an amendment to, or a waiver from, a provision of our Code of Business Conduct and Ethics by posting such information on our website.
Board Committees
Board committees work on key issues in greater detail than would be possible at full Board meetings. The Board has appointed four standing committees: the Audit Committee, the Compensation Committee, the Nominating and Corporate Governance Committee and the Strategic Planning Committee. Each of these Board committees is comprised entirely of independent directors and operates under a written charter, which sets forth the committees’ authorities and responsibilities. The charters are posted on our website at www.poolcorp.com in the “Investors” section under the “Management & Governance”“Governance” link.
The following table lists our 2018 Board committees, the chairs of each committee, the directors who served on them following the 20162018 annual meeting and the number of committee meetings held in 2016.2018.
| | | | Audit Committee | Compensation Committee | Nominating and Corporate Governance Committee | Strategic Planning Committee | Audit Committee | Compensation Committee | Nominating and Corporate Governance Committee | Strategic Planning Committee |
| Andrew W. Code | | ü | | | ü | |
| Timothy M. Graven | Chair | | ü
| | Chair | | ü | |
| Harlan F. Seymour | | Chair | ü | Chair | | Chair | ü | Chair |
| Robert C. Sledd | ü | | ü | |
| John E. Stokely | ü
| | Chair | | ü | | Chair | |
| David G. Whalen | ü
| | ü | ü | | ü |
| Meetings held in 2016 | 8 | 7 | 3 | 2 | |
| Meetings held in 2018 | | 8 | 5 | 4 | 1 |
The following sections briefly describe our Board committees and outline certain of their principal functions. These descriptions are qualified in their entirety by the full text of the Board committee charters.
Audit Committee
The Audit Committee assists the Board in monitoring:
| |
| ▪ | management’s process for ensuring the integrity of our financial statements; |
| |
| ▪ | the independent registered public accounting firm’s qualifications and independence; |
| |
| ▪ | the performance of our internal audit function and independent registered public accounting firm; |
| |
| ▪ | information technology security and risk, including cyber security; and |
| |
| ▪ | management’s process for ensuring our compliance with legal and regulatory requirements. |
The Board has determined that each Audit Committee member meets the requirements for independence, experience and expertise, including financial literacy, as set forth in the applicable SEC and NASDAQNasdaq rules. The Board has further determined that Messrs. Graven, Sledd, Stokely and Whalen are “audit committee financial experts” as defined in the SEC rules.
Compensation Committee
Our Compensation Committee is responsible for oversight of our executive compensation and makes recommendations to our entire Board with respect to director compensation, cash award plans for senior management and equity-based plans for all employees. All members of the Compensation Committee are independent based on the applicable definition of independence for compensation committee members in NASDAQNasdaq listing standards and Rule 16b-3 of the Securities Exchange Act of 1934, as amended (the Exchange Act), and Section 162(m) of the Internal Revenue Code (Section 162(m)). The Compensation Committee’s specific responsibilities and duties are outlined in detail in our Compensation Committee Charter. The Compensation Committee has full and final authority in connection with the administration of our stockequity compensation plans and, in its sole discretion, may grant options and makeequity-based awards of shares under such plans.
The Compensation Committee has the authority to engage the services of outside advisers, experts and others. Specifically, the Compensation Committee may periodically retain an independent compensation consultantsconsultant to review the overall structure and design of our compensation programs and their suitability in meeting our compensation objectives. In addition, when the Compensation Committee considers changes to specific compensation programs, are considered, the Compensation Committeethey may use an outside consultant to review the design and suitability of that specific program.
In 2015, in an effort to continue to ensure that our executive compensation properly aligns with the interests of our stockholders and remains comparable with the market, the Compensation Committee engaged Lyons, Benenson & Company Inc. (Lyons), a compensation consultant, to review our 2016 executive compensation program and peer group composition. Also in 2015, the Compensation Committee engaged Lyons to conduct a review of non‑employee director and chairman compensation. Lyons reported directly to the Compensation Committee chairman and was advised by the Compensation Committee to compare our director compensation program against our peer group. As required by SEC and NASDAQNasdaq rules, the Compensation Committee has assessed the independence of Lyons, determined that Lyons is independent from management and concluded that Lyons’ work did not raise any conflict of interest. The Compensation Committee didhas not retainretained Lyons in 2016since 2015 because the 2017we have not made material changes to our compensation structures for our NEOs and directors did not differ materially from our 2016 compensation plans.since then.
For more information regarding the processes used by the Compensation Committee to determine executive compensation, see the section titled “Compensation Discussion and Analysis” below.
Nominating and Corporate Governance Committee
The Nominating and Corporate Governance Committee’s primary purpose is to provide oversight on a broad range of issues surrounding the composition of the Board, including:
| |
| ▪ | identifying qualified individuals to be considered for nomination as a director; |
| |
| ▪ | recommending to the Board director nominees for the next annual meeting of stockholders; |
| |
| ▪ | assisting the Board in committee member selection; |
| |
| ▪ | evaluating the overall effectiveness of the Board and committees of the Board; and |
| |
| ▪ | reviewing and considering corporate governance practices. |
The Nominating and Corporate Governance Committee has the authority to recommend to the Board candidates for Board membership. Stockholders may also make recommendations for director nominations by sending a letter to the Nominating and Corporate Governance Committee in care of our Corporate Secretary at 109 Northpark Boulevard, Covington, Louisiana 70433. Stockholders making nominations must also comply with the notice procedures set forth in our Bylaws. The Nominating and Corporate Governance Committee evaluates such candidates in the same manner as other candidates.
Strategic Planning Committee
The Strategic Planning Committee assists senior management in the analysis and preparation of our strategic plan, and then reports and makes recommendations regarding our strategic plan to the Board. Our strategic planning process involves defining the Company’s strategy and making decisions on allocating resources, including capital and people, to pursue this strategy. Our strategic plan, which we update and review with the Board periodically, incorporates specific goals for growth and business development over the next three to five years.
Compensation Committee Interlocks and Insider Participation
During the last fiscal year, Messrs. Seymour, Code and Sledd served on the Compensation Committee and none of them served at any time as officers or employees of the Company or any of its subsidiaries. None of our executive officers served in the last fiscal year as a member of the board of directors or compensation committee of another entity, one of whose executive officers served as a member of our Board or Compensation Committee.
Information about our Executive Officers
The following table presents, as of March 15, 2017,14, 2019, certain information about our current executive officers (other than Mr. Perez de la Mesa, our President and Chief Executive Officer, whose biographical information appears under “Election of Directors”).officers. We expect that each of these officers will remain in his or her current position following the Annual Meeting.
|
| | |
| Name and age | Positions and recent business experience | |
Peter D. Arvan (51)(53) | President and Chief Executive ViceOfficer § President and Chief Executive Officer since January 2019 § Chief Operating Officer from August 2017 to January 2019 § Executive Vice President sincefrom January 2017 to January 2019 § Chief Executive Officer of Roofing Supply Group from 2013 to 2015 § President of SABIC Polymershapes from 2004 to 2013
| |
A. David Cook (61)(63) | Group Vice President § Group Vice President since 2007 § Vice President from 1997 to 2007 § Director of National Sales Development of our principal operating subsidiary from 1993 to 1997
| |
Mark W. Joslin (57)(59) | Senior Vice President, Chief Financial Officer § Senior Vice President, Chief Financial Officer since 2015 § Vice President, Chief Financial Officer sincefrom 2004 to 2015 § Vice President of Corporate Development of Eastman Chemical Company (Eastman) from 2002 to 2004 § Vice President and Controller of Eastman from 1999 to 2002
| |
Kenneth G. St. Romain (54)(56) | Group Vice President § Group Vice President since 2007 § General Manager from 2001 to 2007 § Regional Manager from 1987 to 2001
| |
Jennifer M. Neil (43)(45) | Vice President, Corporate Secretary, General CounselChief Legal Officer § Vice President since 2018 § Corporate Secretary since 2005 § General CounselChief Legal Officer since 2003
| |
Melanie M. Housey Hart (44)(46) | Vice President, Corporate Controller, Chief Accounting Officer § Vice President since February 2019 § Chief Accounting Officer since 2008 § Corporate Controller since 2007 § Senior Director of Corporate Accounting from 2006 to 2007 § Senior Manager at Ernst & Young LLP from 2001 to 2006 | |
PRINCIPAL STOCKHOLDERS
In accordance with Rule 13d-3 under the Exchange Act, the table below sets forth, as of March 15, 2017,14, 2019, certain information regarding beneficial ownership of Common Stock by (i) each of our directors, (ii) each of the executive officers listed in the Summary Compensation Table included in “Executive Compensation” (Named Executive Officers), (iii) all of our directors and executive officers as a group and (iv) each stockholder known by us to be the beneficial owner of more than 5% of our outstanding Common Stock. Based on information furnished to us by such stockholders, unless otherwise indicated, all shares indicated as beneficially owned are held with sole voting and investment power. On February 26, 2015, the Board adopted a policy that prohibits ourOur executive officers and directors are prohibited from pledging the Company’s Common Stock as collateral for a loan, including through the use of traditional margin accounts with a broker.
| | | Name of Beneficial Owner | Number of Shares Beneficially Owned | (1) | Percentage of Outstanding Common Stock | Number of Shares Beneficially Owned (1) | | Percentage of Outstanding Common Stock |
| Directors | | | | | | |
| Wilson B. Sexton | 420,257 |
| (2) | 1% | |
| Andrew W. Code | 59,965 |
| (3) | * | 25,832 |
| (2) | * |
| Timothy M. Graven | 2,371 |
| | * | 4,226 |
| | * |
| Debra S. Oler | | — |
| | * |
| Manuel J. Perez de la Mesa | 1,678,633 |
| (4) | 4% | 1,605,643 |
| (3) | 4% |
| Harlan F. Seymour | 30,508 |
| | * | 16,861 |
| | * |
| Robert C. Sledd | 37,287 |
| (5) | * | 26,176 |
| | * |
| John E. Stokely | 29,768 |
| | * | 21,623 |
| | * |
| David G. Whalen | 2,383 |
| | * | 4,296 |
| | * |
Named Executive Officers (6) | | | |
Named Executive Officers (4) | | | |
| Peter D. Arvan | | 38,433 |
| | * |
| A. David Cook | 133,498 |
| (7) | * | 59,392 |
| | * |
| Mark W. Joslin | 201,584 |
| (8) | * | 127,356 |
| | * |
| Jennifer M. Neil | 20,845 |
| (9) | * | |
| Kenneth G. St. Romain | 342,447 |
| (10) | * | 303,336 |
| (5) | * |
| | | | | |
| All executive officers and directors as a group (14 persons) | 2,997,213 |
| (11) | 7% | 2,284,445 |
| (6) | 6% |
| Greater than 5% Beneficial Owners | | | | |
| BlackRock, Inc. | 3,083,882 |
| (12) | 8% | 3,535,555 |
| (7) | 9% |
| JPMorgan Chase & Co | | 2,023,366 |
| (8) | 5% |
| Neuberger Berman Group LLC | 2,804,067 |
| (13) | 7% | 2,160,251 |
| (9) | 5% |
| The Vanguard Group, Inc. | 3,045,983 |
| (14) | 7% | 3,462,928 |
| (10) | 8% |
| T. Rowe Price Associates, Inc. | | 1,846,373 |
| (11) | 5% |
_______________
* Less than one percent.
| |
(1) | Includes shares of unvested restricted stock for executive officers and directors as these shares convey the right to vote and receive dividends. |
| |
(2) | Includes (i) 19,929 shares that may be acquired upon the exercise of presently exercisable options or the exercise of options which will become exercisable on or before May 14, 2017, all of which are held by a trust for which Mr. Sexton serves as trustee; (ii) 25,087 shares held directly by a charitable foundation over which Mr. Sexton has voting and investment power with respect to such shares; (iii) 50,565 shares beneficially owned by Mr. Sexton’s wife; and (iv) 320,231 shares held by a trust for which Mr. Sexton serves as trustee. |
| |
(3)
| Includes 40,00014,965 shares held by a family trust for which Mr. Code serves as co-trustee and 15,0008,000 held directly by a charitable foundation of which Mr. Code is a director and president (although neither Mr. Code nor any members of his immediate family have a pecuniary interest in such shares). |
| |
(4)(3)
| Includes (i) 768,750689,340 shares that Mr. Perez de la Mesa has the right to acquire upon the exercise of presently exercisable options or the exercise of options which will become exercisable on or before May 14, 2017;13, 2019; (ii) 5,000 shares beneficially owned by Mr. Perez de la Mesa’s wife; (iii) 190,655212,230 shares held by a trust for which Mr. Perez de la Mesa serves as a trustee; and (iv) 662,577640,032 shares held in three irrevocable trusts for the benefit of Mr. Perez de la Mesa’s adult children. |
| |
(5)
| Includes 21,662 shares that Mr. Sledd has the right to acquire upon the exercise of presently exercisable options or the exercise of options which will become exercisable on or before May 14, 2017. |
| |
(6)(4)
| Information regarding shares beneficially owned by Mr. Perez de la Mesa, our chief executive officer, who iswas an NEO in additionprior to Ms. Neil and Messrs. Cook, Joslin and St. Romain,his retirement effective December 31, 2018, appears above under the caption “Directors.” |
| |
(7)(5)
| Includes 78,000 shares that Mr. Cook has the right to acquire upon the exercise of presently exercisable options or the exercise of options which will become exercisable on or before May 14, 2017. |
| |
(8)
| Includes 79,000 shares that Mr. Joslin has the right to acquire upon the exercise of presently exercisable options or the exercise of options which will become exercisable on or before May 14, 2017. |
| |
(9)
| Includes 2,000 shares that Ms. Neil has the right to acquire upon the exercise of presently exercisable options or the exercise of options which will become exercisable on or before May 14, 2017. |
| |
(10)
| Includes 257,625211,432 shares that Mr. St. Romain has the right to acquire upon the exercise of presently exercisable options or the exercise of options which will become exercisable on or before May 14, 2017.13, 2019. |
| |
(11)(6)
| Includes 1,242,216932,218 shares that such persons have the right to acquire upon the exercise of presently exercisable options or the exercise of options which will become exercisable on or before May 14, 2017.13, 2019. Also includes 1,213,463867,227 shares held in family trusts, 40,0878,000 shares held in a charitable foundationsfoundation and 55,5655,000 shares held by family members of such persons. |
| |
(12)(7)
| Based upon suchon the holder’s Schedule 13G/A filed with the SEC on January 25, 2017.February 6, 2019. BlackRock, Inc. has sole voting power over 2,941,0613,385,750 shares and sole dispositive power with respect to all shares. The business address of BlackRock, Inc. is 55 East 52nd Street, New York, New York 10055. |
| |
(13)(8)
| Based upon suchon the holder’s Schedule 13G filed with the SEC on January 11, 2019. JPMorgan Chase & Co has sole voting power over 1,869,807 shares, shared voting power over 2,810 shares, sole dispositive power over 2,018,918 shares and shared dispositive power over 2,879 shares. The business address of JPMorgan Chase & Co is 270 Park Avenue, New York, New York 10017. |
| |
(9) | Based on the holder’s Schedule 13G/A filed with the SEC on February 14, 2017.13, 2019. Neuberger Berman Group LLC (Neuberger) has shared voting power and shared dispositive powerwith respect to 2,141,416 shares with Neuberger Berman Investment Advisers LLC and shared dispositive power with respect to all shares. Neuberger Berman Equity Funds has shared voting power and shared dispositive power with respect to 2,087,798over 1,493,349 shares. The business address of Neuberger is 1290 Avenue of the Americas, New York, New York 10104. |
| |
(14)(10)
| Based upon suchon the holder’s Schedule 13G/A filed with the SEC on February 13, 2017.12, 2019. The Vanguard Group, Inc. (Vanguard), an investment advisor, has sole voting power over 24,60721,952 shares, shared voting power over 4,9755,275 shares, sole dispositive power over 3,019,2113,439,721 shares and shared dispositive power over 26,77223,207 shares. The business address of Vanguard is 100 Vanguard Boulevard, Malvern, Pennsylvania 19355. |
| |
(11) | Based on the holder’s Schedule 13G/A filed with the SEC on February 14, 2019. T. Rowe Price Associates, Inc. (T. Rowe Price) has sole voting power over 528,639 shares and sole dispositive power over all shares. The business address of T. Rowe Price is 100 E. Pratt Street, Baltimore, Maryland 21202. |
EQUITY COMPENSATION PLAN INFORMATION
All of the Company’sour existing equity compensation plans were approved by our stockholders. The following table provides information about shares of Common Stock that may be issued under all of the Company’sour existing equity compensation plans as of December 31, 2016.2018.
| | | Plan description | Plan description | Number of shares of Common Stock to be issued upon exercise of outstanding options, warrants and rights | Weighted-average exercise price of outstanding options, warrants and rights | Number of shares of Common Stock remaining available for future issuance under equity compensation plans | Plan description | Number of shares of Common Stock to be issued upon exercise of outstanding options, warrants and rights | Weighted-average exercise price of outstanding options, warrants and rights | Number of shares of Common Stock remaining available for future issuance under equity compensation plans |
| Equity Compensation Plans Approved by Stockholders: | Equity Compensation Plans Approved by Stockholders: | | | | Equity Compensation Plans Approved by Stockholders: | | | |
| | 2007 Long-Term Incentive Plan (2007 LTIP) | 2,525,509 |
|
| $34.69 |
| 4,808,577 |
| (1) | 2007 Long-Term Incentive Plan (2007 LTIP) | 1,879,151 |
|
| $48.19 |
| 4,453,450 |
| (1) |
| | 2002 Long-Term Incentive Plan (2002 LTIP) | 25,374 |
| 36.24 |
| — |
| | Employee Stock Purchase Plan | — |
| — |
| 100,463 |
| |
| | Employee Stock Purchase Plan | — |
| — |
| 135,152 |
| | |
| Equity Compensation Plans Not Approved by Stockholders | Equity Compensation Plans Not Approved by Stockholders | — |
| — |
| — |
| | Equity Compensation Plans Not Approved by Stockholders | — |
| — |
| — |
| |
| | Total | 2,550,883 |
|
| $34.70 |
| 4,943,729 |
| | Total | 1,879,151 |
|
| $48.19 |
| 4,553,913 |
| |
(1) Includes 1,278,3501,108,023 shares that may be issued as restricted stock.
For a complete description of the Company’sour equity compensation plans, see Note 6 to the Company’s 2016in our 2018 Annual Report on Form 10-K.
COMPENSATION DISCUSSION AND ANALYSIS
This compensation discussion and analysis section (the CD&A) describes and analyzes our executive compensation philosophy and program in the context of the compensation paid during the last fiscal year to our named executive officers (collectively, our Named Executive Officers or NEOs). This list includes our chief executive officer (CEO), our chief financial officer (CFO) and our next three most highly-compensated executivesexecutive officers as of December 31, 2016.2018.
For fiscal 2016,2018, our Named Executive Officers were:
| |
| ▪ | Manuel J. Perez de la Mesa, President, Chief Executive Officer and Director; |
| |
| ▪ | Mark W. Joslin, Senior Vice President and Chief Financial Officer; |
| |
| ▪ | Peter D. Arvan, Executive Vice President and Chief Operating Officer; |
| |
| ▪ | A. David Cook, Group Vice President; and |
| |
| ▪ | Kenneth G. St. Romain, Group Vice President; andPresident. |
| |
▪ | Jennifer M. Neil, Corporate Secretary and General Counsel. |
Mr. Perez de la Mesa retired from his position as president and CEO effective December 31, 2018; the Board appointed Mr. Arvan as president and CEO effective January 1, 2019.
In this CD&A, we first provide an Executive Summary of our actions and highlights from 2016.2018. We next explain the principles that guide our Compensation Committee’s executive compensation decisions, our Compensation Philosophy and Objectives. We then describe the Compensation Committee’s Process of Setting Compensation, including any supporting role played by the NEOs themselves. Finally, we discuss in detail each of the Components of Compensation, which includes, for each component, a design overview as well as the actual results yielded for each NEO in 2016.2018.
Executive Summary
Our Company is the world’s largest wholesale distributor of swimming pool supplies, equipment and related leisure products with approximately 100,000 wholesale customers aroundand is one of the world.top three distributors of irrigation and landscape products in the United States. We operate 344364 sales center locations worldwide, withfrom which our approximately 3,900 employees.4,000 employees serve roughly 120,000 wholesale customers. For more information about our business, please see Item 1, “Business,” and Item 7, “Management’s Discussion and Analysis of Financial Condition and Results of Operations,” in our Annual Report on Form 10-K for the fiscal year ended December 31, 2016.2018.
Over the past six years, the pool industry has continued to show signs of recovery, mostly due to the gradual improvement in remodeling and replacement activity. Our consistent base business sales growth reflects industry growth plus market share gains from our existing customers expanding their businesses and our success in newer market initiatives such as building materialshardscapes and commercial pools. Improvements in general external market factors in the United States, including consumer confidence, employment, housing, and economic expansion, largely supportssupport our base business growth. We feel these positive external trends have promoted increased consumer spending on higher value products that enhance swimming pools and outdoor living spaces.
Overview of Fiscal 20162018
Our Company’s financial and operational accomplishments for fiscal 20162018 included the following:
| |
| ▪ | Sales growthrecord annual sales of 9% to a record $2.57 billion;nearly $3.0 billion, up 8% from 2017; |
| |
| ▪ | Operating income improvement of 18% and record operating marginincome of 10.0%;$313.9 million, up 10% over 2017; |
| |
| ▪ | 2016 diluted EPS up 20% torecord operating margin of 10.5%, a record $3.47;30 basis point increase over last year; and |
| |
| ▪ | Net cash provided by operating activities that was 111%record 2018 diluted EPS of net income.$5.62, an increase of 25% over 2017, including a tax-related benefit of $0.36 per share. |
2016provedDespite a shorter-than-normal season due to beboth a yearlate start and an early end brought on by unfavorable weather, we delivered sales growth of excellent results.8% in 2018, on top of sales growth of 8% in 2017. We attribute our solid sales growth and even stronger profit growth to a combination of strong execution and continuing favorable weather. Warmer than average temperatures, especially in the beginning and end of the year, lengthened the 2016 season and benefited sales, which were also bolstered by growth in pool remodeling, equipment replacement, swimming pool construction and our increased focus on the commercial market. We believe thatmarket conditions. Base business sales growth ratesof 7% was fueled by market share gains and continued demand for certain product offerings,discretionary products, such as building materials, lighting, and equipment, support our assertion that there continuespool equipment. We also delivered double-digit growth for commercial pool product sales in North America, where demand and market share gains were strong. Our focus on organic growth, process discipline and value creation allowed us to be increased consumer spending in traditionally discretionary areas including pool construction, pool remodeling, as well as equipment upgrades. These increases reflect both the gradual recoveryconvert this top-line growth into operating income growth of replacement activity and increased demand for higher-priced, more energy-efficient products.
10% over last year.
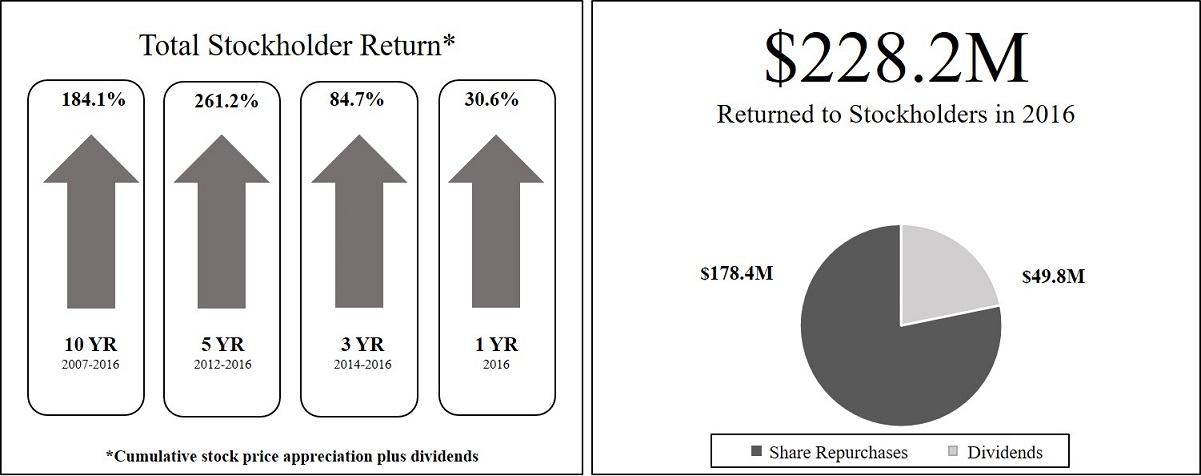
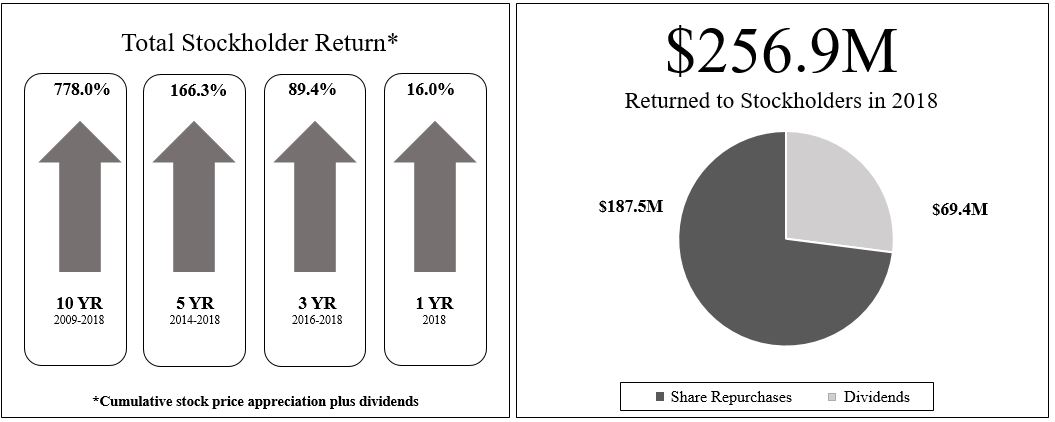
Return to Stockholders
We have delivered consistent positive returns to our stockholders over time, and in 20162018 we continued our long history of increasing dividends and conducting share repurchases.
20162018 Executive Compensation Program Highlights
| |
| ▪ | Our executive compensation program is designed and implemented by the Compensation Committee, which strives to incorporate compensation best practices into our program design. The following summary highlights our commitment to executive compensation practices that align the interests of our executives and stockholders: |
|
| | | | |
| | What we do: | | | What we don’t do: |
| | | | | |
| ü | Our executive pay is predominantly performance-based and not guaranteed. | | û | We do not provide excessive perquisites to our executives. |
| ü | All of our variable compensation plans have caps on plan formulas. | | û | Directors and NEOs are prohibited from pledging and hedging their shares of company stock. |
| ü | Our equity plans contain “double trigger” change of control vesting provisions. | | û | Our equity plans prohibit the repricing of underwater stock options. |
| ü | We benchmark pay relative to the market and review our peer group annually. | | û | We do not provide any change of control payments to our executive officers. |
| ü | We maintain share ownership guidelines. | | û | We do not have any related party transactions.transactions with our executive officers. |
| ü | We maintain executive compensation clawback provisions. | | û
| We do not provide excise tax gross-ups. |
| ü | The Compensation Committee, like all of our Board committees, is comprised solely of independent directors. | | | |
| ü | Our Compensation Committee periodically retains its own independent compensation consultant. | | | |
| ü | Beginning in 2016, restricted stock awards include performance-based vesting criteria. | | | |
| |
▪ | In 2016, our Compensation Committee added performance-based vesting criteria for our restricted stock awards granted under our long-term incentive plan (LTIP). |
| |
▪ | Also in May 2016, our stockholders approved the terms of our Pool Corporation Executive Officer Annual Incentive Plan (AIP), allowing our Compensation Committee to structure annual cash bonus payments to our executive officers that qualify as performance-based compensation. |
| |
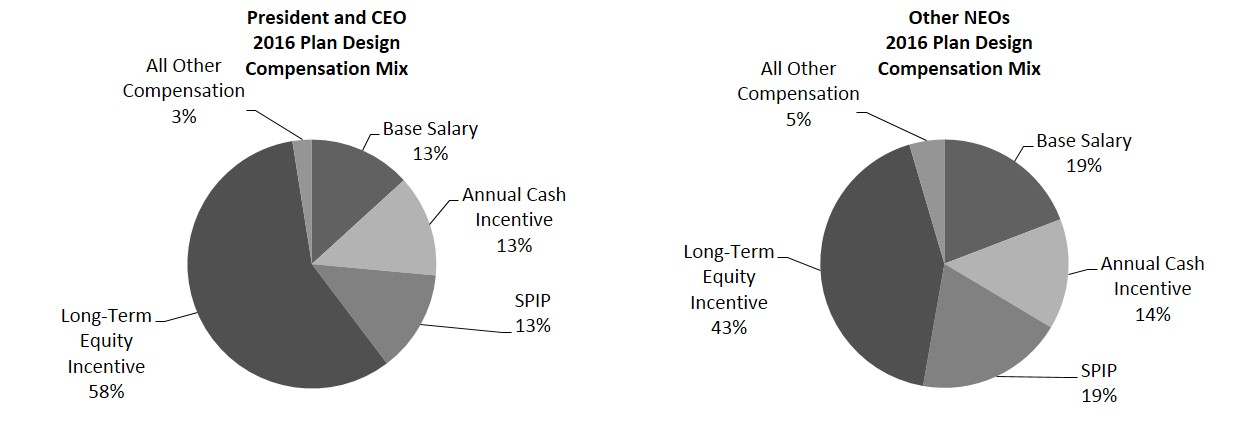
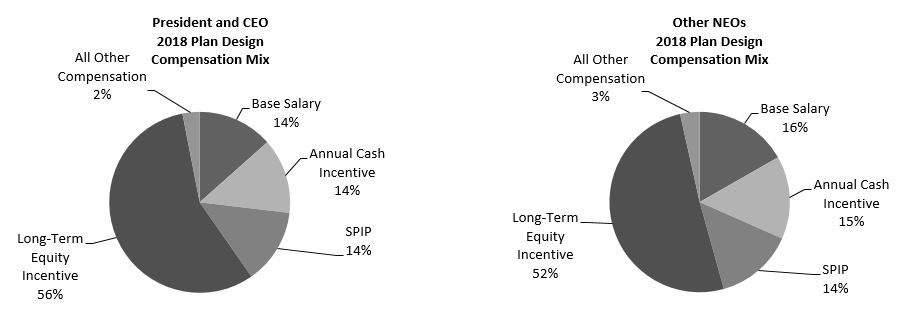
| ▪ | A majority of each NEO’s target compensation has been and continues to be at-risk. The charts below show the 20162018 plan design, or target, compensation mix by component: |
| |
| ▪ | The Compensation Committee approved only a marginal increase in base salaries for each NEO (less than 3% on average), consistentConsistent with its long-standing policy of placing greater emphasis on the performance-based components of compensation.compensation, the Compensation Committee approved only a marginal increase in base salaries during 2018 for each NEO (less than 3% on average), with the exception of Mr. Arvan, who received a 10% increase in recognition of his promotion to chief operating officer in August 2017 and his expanded responsibilities in his new role. |
| |
| ▪ | For fiscal year 2018, we modified our annual cash performance award plan so that operating income is the primary financial measure. Previously, diluted EPS served as the primary financial metric for annual bonuses. Like EPS, operating income is an important driver of value creation for our stockholders, has had a strong long-term correlation with our stock price over time, and is performance-based. Further, operating income is not impacted by tax benefits related to share-based compensation expense or recent changes to federal tax rates. |
| |
| ▪ | The Compensation Committee approved the samean annual cash performance potential as the prior year for each NEO, with 2018 plan design targeted at 100% of base salary for our CEOMessrs. Perez de la Mesa, Arvan and Cook, and 75% of base salary for Messrs. Joslin and St. Romain. Actual 2018 annual cash performance awards were 71.3% of base salary for Mr. Perez de la Mesa and averaged 73.2% of base salary for our other NEOs. Actual 2016 annual cash performance awards were 168% of base salary for our CEO and averaged 118% of base salary for our other NEOs based primarily on our attainment of the target level of the diluted earnings per share (EPS) component (the primarily financial component) of the annual performance award. |
| |
| ▪ | The Compensation Committee continued to emphasize the importance of our long-term growth by providing substantial pay‑for‑performance compensation opportunities through the medium-term Strategic Plan Incentive Program (SPIP) and the LTIP.Amended and Restated 2007 Long-Term Incentive Plan (2007 LTIP). For the 20162018 SPIP grant, which is based on the diluted EPS growth in the three-year cumulativeperformance period from 20162018 to 2018,2020, adjusted diluted EPS at December 31, 2017 of $3.99 serves as the baseline for the performance period, except that the Compensation Committee establishedfurther considered the diluted EPS baseline at $2.90, which was our 2015 diluted EPS. Actual 2016 cash paymentsimpact going forward of the lower tax rate under the SPIP were 186%Tax Cuts and Jobs Act (the TCJA) and therefore increased the baseline EPS to $4.74, thereby increasing the rigor of base salary (out of a possible 200% for maximum performance) for our NEOs, representing an adjusted diluted EPS CAGR of 19.3% for the 2014 to 2016 performance period.award. |
| |
▪ | Beginning with grants in 2015, our equity awards are subject to “double trigger” accelerated vesting upon a change of control; this means our unvested equity awards accelerate only if there is both a change of control and the executive experiences a qualifying termination within two years following the change of control. |
Cash payments under the SPIP for the performance period ended December 31, 2018 were 102% of base salary (out of a possible 200% for maximum performance) for our NEOs, with the exception of Mr. Arvan who joined the company in January of 2017 and thus received a pro-rated payout of 51% of his base salary. These SPIP payments represented an adjusted diluted EPS CAGR of 15.1% for the 2016 to 2018 performance period.
| |
| ▪ | The Compensation Committee determined the 20162018 equity grants for all NEOs based on total compensation targets approximating the peer group median for total compensation.compensation; grants of restricted stock awards to our NEOs contain performance-based vesting criteria (return on invested capital). |
| |
| ▪ | With regard to our CEO’s 2016Mr. Perez de la Mesa’s 2018 compensation, the Compensation Committee kept the same compensation plan design intact with a very modest salary increase (2.1%)of 2.0%, the same annual cash performance program potential, as well asand the same medium-term SPIP and long-term equity components, although a performance condition was added to the restricted stock awards granted in 2016.components. |
Results Compared to Peers
We designOur Compensation Committee designs total compensation for our executives to target or approximate the peer median for total compensation (sometimes referred to as compensation“compensation by design)design”), but ultimately our executives’ total compensation varies depending on our performance. Our peer group is comprised of public companies primarily engaged in wholesale distribution and of similar size based on both revenues and market capitalization. See “Process of Setting Compensation - Benchmarking and Establishment of Peer Group” for further information on our peer group.
The table below presents compoundedcompound annual growth rates (CAGR) for our EPS and stock price performance as well as our total stockholder return (TSR) performance compared to our peer group median as of December 31, 2016.2018. In addition to our peer group, we believe thatit is helpful to measure our performance should also be measured against the S&P MidCap 400 Index because (a) it is comprised of more similar-sizedsimilar‑sized public companies that represent the most likely alternative investments for investors and (b) we have no direct public company peers given the niche nature of our industry. Given that our compensation philosophy stresses the long-term growth of stockholder value, we believe that longer-term performance data provides the most appropriate comparisons.
| | | | | Pool Corporation | | | | | | | Pool Corporation | | | | | |
| | | Adjusted(1)
Diluted EPS
CAGR | |
Stock Price
CAGR | | TSR
CAGR | | Peer Group
Median
TSR(2) CAGR | | S&P MidCap
400 Index
CAGR(3) | | | Adjusted(1)
Diluted EPS
CAGR | |
Stock Price
CAGR | | TSR
CAGR | | Peer Group
Median
TSR(2) CAGR | | S&P MidCap
400 Index
CAGR(3) | |
| 1-year | | 20.0 | % | | 29.2 | % | | 30.6 | % | | 24.5 | % | | 18.7 | % | | | 23.2 | % | | 14.7 | % | | 16.0 | % | | (16.4 | )% | | (12.5 | )% | |
| 3-year | | 19.3 | % | | 21.5 | % | | 22.7 | % | | 1.9 | % | | 7.3 | % | | | 22.0 | % | | 22.5 | % | | 23.7 | % | | (0.5 | )% | | 5.9 | % | |
| 5-year | | 18.3 | % | | 28.2 | % | | 29.3 | % | | 8.7 | % | | 13.6 | % | | | 20.7 | % | | 20.7 | % | | 21.6 | % | | 1.5 | % | | 4.4 | % | |
| 10-year | | 7.2 | % | | 10.3 | % | | 11.0 | % | | 9.4 | % | | 7.5 | % | | | 16.2 | % | | 23.5 | % | | 24.3 | % | | 12.7 | % | | 11.7 | % | |
| |
(1) | The adjusted diluted EPS CAGR amounts are based on adjusted 2016 diluted 2018 EPS of $5.26, which excludes a non-cash goodwill impairment charge of $0.6 million, or $0.01$0.36 per diluted share. Additionally,share benefit from the 5-year CAGR is also based on adjusted 2011 diluted EPS, which excludes a non-cash goodwill impairment chargeimpact of $1.6 million, or $0.03 per diluted share.Accounting Standards Update 2016-09, Improvements to Employee Share‑Based Payment Accounting (ASU 2016-09). |
The 1-year diluted EPS CAGR is also based on adjusted 2017 diluted EPS of $4.27, which excludes a $0.24 benefit from the impact of ASU 2016-09.
| |
(2) | We calculated TSR based on changes in the market price of each company’s common stock plus dividends paid during the respective periods, if applicable, using information from company financial statements and various financial websites including www.nasdaq.com. In calculating TSR, we used stock-split adjusted amounts for both historical market prices and dividends paid. |
| |
(3) | As reported by NASDAQ.Nasdaq. |
As reflected in the table below, 2016 actual2018 total compensation for our NEOs was 22%10% higher than the peer group median amount. This difference largely reflectsFor the 2018 fiscal year, we attribute our performance overhigher-than-peer pay to the following factors:
In 2018, our total NEO compensation included that of our outgoing CEO, Mr. Perez de la Mesa, who retired effective December 31, 2018, as well as the compensation of his successor, Mr. Arvan;
Over the one-and three-year time frames during whichperiods ended December 31, 2018, our total stockholder returnTSR CAGR was 30.6%16.0% and 22.7%23.7% compared to our peer group median total stockholder returnTSR CAGR of 24.5%(16.4)% and 1.9%(0.5)%, respectively. Moreover,respectively, which resulted in higher payouts of performance awards than our peers; further, our stock price CAGR also exceeds that of the S&P MidCap 400 Index for all periods presented above. above; and
As such, our higher-than-peer pay was based on our exceptional performance and, as discussed in the footnote below, the fact that the peer group compensation data used in our comparison is generally a year or more old.
| | Total Compensation Above (Below) Peer Group Medians(1) | Total Compensation Above (Below) Peer Group Medians(1) | Total Compensation Above (Below) Peer Group Medians(1) |
| Position | | 2016 Actual | | 2016 Plan Design | | 2018 Actual | | 2018 Plan Design |
| CEO | | 10 | % | | (7 | )% | | (28 | )% | | (23 | )% |
| All Other NEOs | | 30 | % | | 3 | % | | 44 | % | | 50 | % |
| Total NEOs | | 22 | % | | (1 | )% | | 10 | % | | 16 | % |
| |
(1) | Our Compensation Committee set our compensation plan design for fiscal 20162018 in February 2016.2018. At that time, peer group compensation data for 20152017 was not available. Therefore, the peer group median amounts used for comparison in the above table were calculated primarily using 20142016 compensation data. |
The actual amounts in the table above reflect the reported amounts per the Summary Compensation Table, except for the value of stock options. For both our stock options and our peer group’s stock options, rather than use the estimated grant date fair values as reported in the proxy statements, we estimated stock option values by multiplying the number of stock options awarded by 40% of the stock’s closing price on the grant date (assuming this price equals the exercise price). We believe this eliminates potential differences related to fair value assumptions for expected term, volatility and dividend yield, thus improving the comparability to our peer group.
After review of all existing programs, consideration of current market and competitive conditions, and alignment with our overall compensation objectives and philosophy, we believe that the total compensation program for our executives is appropriately focused on enhancing corporate performance and increasing value for stockholders and enhancing corporate performance.stockholders. We believe that a significant part of our executive pay is properly tied to stock appreciation or stockholder value through stock options, restricted stock awards and incentive performance measures.
Results of 20162018 Say-on-Pay Vote
At our 20162018 annual meeting of stockholders, in May, our stockholders approved our executive compensation by a vote of 98.0%99.4% of the votes cast (excluding broker non-votes). Because our NEO compensation is principally established in February of each year, the results of the 20162018 say‑on‑pay vote were not taken into consideration in setting the 20162018 executive officer compensation. However, the Compensation Committee did consider the strong stockholder support we received on the 20152017 say-on-pay vote, which was approved by 98.2%99.0% of the votes cast (excluding broker non-votes).
The Board and our Compensation Committee appreciate and value the views of our stockholders. Our Compensation Committee is mindful of the strong support our stockholders expressed and as a result continues to believe that our general approach to and design of executive compensation properly align the interests of our stockholders and our performance. Going forward, the Compensation Committee will continue to review stockholder advisory votes on executive compensation and take them into consideration when making future executive compensation decisions.
Compensation Philosophy and Objectives
We believe our employees are our most important asset. The primary objectives of our compensation program are to attract, motivate, reward and retain talented executives who are critical to our success. The overriding principle of our executive compensation philosophy is that compensation must be linked to continuous improvements in corporate performance and sustained increases in stockholder value. We believe that a substantial portion of executive compensation should be at-risk based on performance and that the majority of the at-risk compensation opportunity should be predicated on medium- and long-term rather than short-term results. We strive to develop our executives’ capabilities and focus them on achieving superior long-term returns for our stockholders, while assuring that our programs do not lead to unnecessary risk taking.
Our executive compensation philosophy applies to all employees, with increasingly greater proportions of total compensation being at-risk as an employee’s responsibility increases. While we place great value on long-term performance and the corresponding improvement in stockholder value, we seek to balance the relationship between total stockholder return and short-term and long-term compensation in order to complement our annual and long-term business objectives and encourage the fulfillment of those objectives through executive performance.
In pursuing these objectives, we seek to design and maintain a program that will accomplish the following:
align total compensation by design to the median total compensation of our peer group;
align compensation with our performance in achieving financial and non-financial objectives;
tie compensation to individual and group performance;
closely align incentive compensation with stockholders’ interests; and
promote equity ownership by executives through long-term performance compensation.
While we have not established specific target percentages of total compensation for short-term and long-term compensation, we do take into consideration the individual components in relation to the total opportunity we seek to provide. Under our program, our performance impacts both short-term and long-term compensation, as superior performance will result in additional compensation through our annual cash performance program and medium-term SPIP and increased value of our equity grants over the long term. Our goal is for the portion of compensation that is at-risk (both short-term and long-term) to constitute a substantial and meaningful portion of total compensation and for sustained long-term growth to result in the greatest compensation opportunities.
Process of Setting Compensation
Our Compensation Committee is responsible for the oversight of our executive compensation. The Compensation Committee approves compensation plans for senior management and equity-based plans for all employees. In its evaluation of executive compensation, the Compensation Committee considers many factors, including the Company’s overall performance; each individual executive’s role and responsibilities, performance, tenure, and experience; and peer group performance.
The Compensation Committee normally meets in February of each year to set executive compensation plans for that fiscal year. To do this, it uses the most current data available for peer group compensation, although this data is generally a year or more old.
Role of Management
The Compensation Committee also relies uponon data, analysis and recommendations from our CEO. While the CEO provides recommendations with respect to potential senior management compensation and the Compensation Committee reviews such recommendations, the Compensation Committee ultimately uses its collective judgment to determine senior management compensation. The CEO does not provide recommendations for his own compensation as the Compensation Committee independently determines and approves his compensation. Although the CEO attends Compensation Committee meetings at which executive compensation matters are considered, he is not present when the Compensation Committee deliberates or votes on his compensation. Our Company’s management also assists the Compensation Committee with developing the peer group analysis.analysis each year.
Role of Compensation Consultant
Our Compensation Committee periodically engages aan independent compensation consultant to review and comment upon director and executive compensation. In 2015, in an effort to continue to ensure that our executive compensation program properly aligns with the interests of our stockholders and remains comparable with the market, the Compensation Committee engaged Lyons, Benenson & Company Inc. (Lyons) to review our 2016 executive compensation program and peer group composition. Also in 2015, theThe Compensation Committee engaged Lyonscontinues to conduct a reviewbelieve that this structure and component mix of non‑employee directorpay elements successfully promotes our compensation objectives and chairman compensation. Lyons reported directly to thephilosophy, and, accordingly, has retained this structure since 2016. The Compensation Committee chairman and was advised bydid not retain a compensation consultant to review our 2017 or 2018 executive compensation structure because the Compensation Committee to comparestructure did not differ materially from our director compensation program against our peer group.2016 executive compensation.
Benchmarking and Establishment of Peer Group
As noted above, we believe that the total target compensation should be closely aligned to the median total compensation of our peer group. We establish compensation targets for each executive position in the aggregate and by component based on a design that we believe will best achieve our strategic and financial objectives. The Compensation Committee compares our main compensation components – base salary, annual bonus, SPIP and equity awards – individually and in the aggregate to the compensation of the most highly compensated executive officers of companies it uses as its “peer group” (the peer group is sometimes referred to as the “market”). These comparisons are based on compensation information published in the peer group’s annual proxy statements of the peer group companies, except for stock options. Rather than use the estimated grant date fair values as reported in the proxy statements, we estimatedestimate stock option values by multiplying the number of stock options awarded by 40% of the stock’s closing price on the grant date (assuming this price equals the exercise price). We believe this adjustment makes the estimated compensation amounts for stock options more comparable between companies by eliminating potential differences related to fair value assumptions for expected term, volatility and dividend yield.
The Compensation Committee reviews management’s evaluation of potential peer companies, approves the annual peer group and also reviews the annual executive compensation analysis that is prepared by management and, in some years, by the compensation consultant. In developing our peer group, we evaluate the following criteria:
| |
| ▪ | organizational structure (public companies); |
| |
| ▪ | type of business (primarily wholesale distribution); |
| |
| ▪ | company size (based on revenue and market capitalization); and |
| |
| ▪ | peer group size (number of peer companies). |
In performing our evaluation, we focus on public companies that we believe would provide a comparable cross-industry subset of distributors. While we evaluate companies that may have some manufacturing or retail operations, we generally exclude companies from consideration if the majority of the business is not wholesale distribution. Since our Global Industry Classification Standard (GICS) industry group (2520 - Consumer Durables & Apparel) is very broad and our GICS industry (252020 - Leisure Equipment & Products) would not provide an adequate peer group size, we believe that using a cross-industry subset of wholesale distributors for our peer group provides a more meaningful executive compensation benchmarking analysis than using companies based on one of our industry sectors.
In the fall of 2015, weThe Compensation Committee reviewed and updated our 2017 peer group by removing MWI Veterinary Supply,and removed Nu Skin Enterprises, Inc. after they were acquired andbecause their executive compensation data was no longer available. We also removed LKQ Corporation and WESCO International,business is not primarily wholesale distribution. The Compensation Committee added Acuity Brands, Inc. as their annual net sales exceeded the top end of, a distribution company within our revenue criterion range and we were able to identify distribution companies with revenue within that range that we believe are better alignedmarket capitalization criteria ranges, to our business. As such, we added Fastenal Company, NOW Inc. and Wesco Aircraft Holdings, Inc. to our 20162018 peer group.
Our 20162018 peer group consisted of the following companies:
|
| | |
ž Acuity Brands, Inc. | ž Fastenal Company | ž Sally Beauty Holdings, Inc. |
žApplied Industrial Technologies, Inc. | žKaman Corporation Helen of Troy Limited | žScanSource, IncInc. |
žBeacon Roofing Supply, Inc. | žMRC Global Inc. Kaman Corporation | ž Steelcase Inc. |
žBoise Cascade Company | ž MSC Industrial Direct Company, BMC Stock Holdings, Inc.
| ž Essendant Inc. (formerly |
ž Builders FirstSource, Inc.
| ž NOW Inc.
| United Stationers Inc.) |
ž DXP Enterprises, Inc.
| ž Nu Skin Enterprises,MRC Global, Inc.
| ž Universal Forest Products, Inc. |
ž FastenalBoise Cascade Company | žPatterson Companies, MSC Industrial Direct Company, Inc. | ž Watsco, Inc. |
ž Helen of Troy LimitedBuilders FirstSource, Inc. | ž Sally Beauty Holdings,NOW Inc. | ž Wesco Aircraft Holdings, Inc. |
ž Essendant Inc. | ž Patterson Companies, Inc. | |
The table below presents our revenue and market capitalization compared to the 2016median of our 2018 peer group median (based on data available in the fall of 20152017 when the 20162018 peer group was established).
| | | (in millions) | | Revenue | | Market capitalization | | Revenue | | Market capitalization |
POOL (1) | | $ | 2,247.0 |
| | $ | 3,090.0 |
| | $ | 2,571 |
| | $ | 4,550 |
|
Peer group median (2) | | 2,851.0 |
| | 1,670.0 |
| | 3,266 |
| | 2,025 |
|
| |
(1) | POOL’s revenue reflects our most recent annual net sales (fiscal year 2014)2016) at the time of our analysis, and our market capitalization is as of September 22, 2015.October 2, 2017. |
| |
(2) | The peer group’sgroup median revenue represents the median annual net sales based on annual public filings available as of September 2015;October 2017; the peer group’sgroup median market capitalization is as of September 22, 2015.October 2, 2017. |
The Compensation Committee reviews each component of compensation compared to the peer group and the prior year’s total compensation for our NEOs versus the peer group. However, the Compensation Committee ultimately focuses on whether total compensation by design aligns closely with the peer group median total compensation amounts. While we compare our CEO position to the CEO positions for our peer group, we compare our other NEOs to the peer group in the aggregate as opposed to by position because we believe it affords a better comparison overall as the positions and responsibilities for this group vary from company to company.
Market medians and the ranges around them only represent beginning reference points. The Compensation Committee also uses its subjective judgment to set compensation that reflects factors such as individual performance and skills, long-term potential, tenure in the position and retention considerations. The Compensation Committee also reviews the total annual compensation that each executive could potentially receive and, for perspective, reviews the previous year’s compensation value for each executive.
The Compensation Committee has considered the impact that paying below the median of our peers might have on attracting, retaining and motivating senior management. The Compensation Committee believes that the fundamental philosophy of emphasizing pay-for-performance is the right one for our Company, and that our core compensation program as currently designed (base salary, annual bonus, SPIP, and equity awards) can provide competitive or superior total compensation for senior management compared to our peer group given a reasonable economic environment. The Compensation Committee continues to believe that the design of our compensation program reflects a greater weighting to performance-based and at-risk compensation than the peer group median, as evidenced by the comparisons of our compensation components to the related peer group median amounts (see tables included in the “Components of Compensation” section below). Provided that our performance meets or exceeds expectations in future years, the Compensation Committee expects our NEOs will realize total compensation comparable or superior to the peer group median over time.
Components of Compensation
Our annual executive compensation program is relatively simple in format and includes four primary components:
|
| | | | |
| Compensation Component | | Key Characteristics | | Purpose |
| Base salary | | Conservative level of fixed cash compensation based on responsibility, experience and tenure | | Provide a fixed, baseline level of cash compensation |
Annual cash award (annual bonus) | | Annual cash payment tied to performance during the fiscal year relative to pre-established performance goals | | Reward for achieving our annual financial and business goals |
| Strategic Plan Incentive Program (SPIP) | | Medium-term cash performance opportunity | | Provide a three-year, performance-based award subject to the achievement of specified earnings objectives, signifying achievement of strategic initiatives |
| Long-term equity awards | | Variable compensation comprised of performance-based restricted stock awards, stock options, or a combination of the two | | Align executive performance with stockholder interests and long-term goals |
As discussed in “Compensation Philosophy and Objectives” above, we believe that employees at senior levels should have a larger proportion of total compensation delivered through pay-for-performance cash awards and long-term equity compensation. As a result, their compensation will be more significantly impacted, both upward and downward, by our financial performance and stockholder return. Because of this correlation, the Compensation Committee believes our executives have a greater percentage of their compensation at-risk than the executives in our peer group. We discuss each compensation component in more detail below.
Base Salary
(Summary Compensation Table, Column 3)
Salaries provide executives with a base level of income and help achieve the objectives outlined above by attracting and retaining strong talent. Our plan design is for total executive compensation at comparable performance levels to be at the peer group’s median total compensation. However, our base salary is more conservative by design and thus consistent with our overall philosophy of focusing on at-risk or performance-based pay. In determining an executive’s base salary, the Compensation Committee reviews Company and individual performance information and peer group executive compensation information.
Changes in our NEOs’ base salaries from year to year reflect general changes in market pay for executive talent, changes in responsibility for individual NEOs from time to time and, to a lesser extent, the individual’s job performance over time. Additionally, base salary levels for all NEOs have been substantially below market historically as compared to our peers. We do not generally provide our NEOs with automatic annual salary increases or other cost of living adjustments.
The 20162018 base salary levels for our NEOs continued to remain low by design as compared to our peer group. The following table below presents the percentage variances betweenby which our 2016 actualNEOs’ 2018 base salary amounts andsalaries are below the peer group median base salary amounts:amounts.
|
| | | |
Base Salary
Above (Below) Below Peer Group Medians(1) |
| Position | | 20162018
Actual |
| CEO | | (4038 | )% |
| All Other NEOs | | (3316 | )% |
| Total NEOs | | (3523 | )% |
| |
(1) | Our Compensation Committee set our compensation plan design for fiscal 2018 in February 2018. At that time, peer group compensation data for 2017 was not available. Therefore, the peer group median amounts used for comparison in the above table were calculated primarily using 2016 compensation data. |
In 2016,February 2018, the Compensation Committee approved a marginal increase in baseincreased executive officer salaries for each NEO. to the following amounts:
|
| | | | | | | |
| Name | | Salary | | Increase |
| Manuel J. Perez de la Mesa | | $ | 500,000 |
| | 2.0 | % |
| Mark W. Joslin | | 295,000 |
| | 2.8 | % |
| Peter D. Arvan | | 440,000 |
| | 10.0 | % |
| A. David Cook | | 317,000 |
| | 3.3 | % |
| Kenneth G. St. Romain | | 310,000 |
| | 3.3 | % |
The average salary increase for the NEOs was less than 3%4.3%. Mr. Perez de la Mesa received a modest 2.1%2.0% increase, and Mr. St. RomainArvan received the greatest percentage increase, 3.6%10.0%, in recognition of his promotion to place him morechief operating officer in line with the target marketAugust 2017 and his fellow NEOs givenexpanded responsibilities in his responsibilities and performance.new role. Mr. Perez de la Mesa, as our CEO, receivesreceived the highest base salary as compared to our other NEOs in recognition of his substantially greater responsibilities. Mr. Perez de la Mesa’s duties and responsibilities encompassencompassed all aspects of our management and operations and arewere greater in scope and collectively more significant in nature than those of any other NEO. Even with these increases, our NEOs’ 20162018 base salaries as a group were 35%23% below the peer group median as shown in the table above.
Annual Incentive Plan
(Summary Compensation Table, Column 6)
(Grants of Plan-Based Awards, Columns 3-4)
We use an annual cash performance award (annual bonus) to focus corporateexecutive behavior on short-term goals for growth, financial performance and other specific financial and business improvement metrics. We offer executives the opportunity to earn goal-oriented awards that are responsive to changing internal and external business conditions from year to year. Each year, objectives are set for the Company, our business units and individual executives. Actual performance is later measured against these objectives. At the first Compensation Committee meeting each year, which is generally held in February, the Committee approves annual bonus payments for the prior year’s performance and reviews and approves goals for each NEO for the current year. Annual bonus payments, if any, are normally made in late February or early March after the end of the performance period in which the bonuses were earned.
In May 2016, our stockholders approvedUnder our Pool Corporation Executive Officer Annual Incentive Plan (AIP)(the AIP), enabling us to grant awards that satisfy the requirements of a performance-based compensation program under Section 162(m). Under the AIP, the Compensation Committee has the discretion to structure the annual bonus program as it deems appropriate, including designing an “umbrella plan” under which one or more performance goals are established to fund a pool, from which individual awards, which may be subject to additional performance criteria, are then made.
20162018 Plan Design
While annual incentive plan payments to our NEOs are based on objective financial measures and each NEO’s attainment of certain business objectives, similar to our 2017 plan, our Compensation Committee added return on invested capital (ROIC) as an additional performance metric, which serves as a threshold performance goal. In February 2016,2018, the Compensation Committee established the performance metrics applicable to awards under the AIP for 20162018 and the maximum bonus payable to each executive officerNEO under the AIP. As approved by the Compensation Committee,Under this plan design, if the Company achieved ROIC of 10% return on invested capital (ROIC)or higher for fiscal year 2016, then2018, a bonus pool of $5,006,000$3,723,500 would be funded to satisfy annual cash awards underbonus payments to all of our executive officers, including the AIP. NEOs. The Compensation Committee then used individual bonus metrics to determine the amounts awarded to each of our NEOs.
To establish our baseline performance goal for performance-based awards issued in 2016,2018, we reviewed our peer companies’ proxy statements and Lyons’ report on executive compensation arrangements presented to our Compensation Committee at the end of 2015. We established the baseline ROIC of 10% for awards granted in 20162018 after reviewing the three-year average ROIC (as prepared by Lyons) for our peers for periods dating back to 2008.
For consistency purposes, we adopted the ROIC calculation used by Lyons in their analysis whereby the numerator is net income attributable to Pool Corporation before after-tax interest expenseand other non-operating expenses, net, and the denominator is the sum of total long-term debt (including the current portion) and stockholders’ equity at fiscal year end. OurCalculated in this way, our ROIC for the year ended December 31, 20162018 was 24.5%28.2%. As such,
Because our 2018 ROIC was greater than 10%, the bonus pool for 20162018 under the AIP was funded. In addition, the Compensation Committee then set additional performance criteria (described below) for each individual NEO in order for the officer to earn his or her allocated portion of the bonus pool.
For 2016,2018, our NEOs’ annual bonus targets were based on the following two objective performance criteria categories:
| |
| ▪ | specific financial measures (EPS(operating income and operational cash flow(1))flow); and |
| |
| ▪ | specific business objectives applicabletailored to each NEO.NEO’s area of responsibility. |
(1) Ms. Neil’s annual bonus plan is based on EPSThe metrics for all NEOs are designed to be challenging and other specific business objectives but is not impacted by operational cash flow.
encourage improvement over the status quo. For 2016,2018, the Compensation Committee used adjusted diluted EPSoperating income as the primary performance financial metric for annual bonuses, as set forth in the table below. The Compensation Committee may authorize EPS adjustments to operating income as specified by our compensation plans and consistent with the requirements of Section 162(m). During the third quarter of 2016, we recorded a non-cash goodwill impairment charge of $0.6 million, which had an impact of $0.01 per diluted share.plans. The Compensation Committee approved 20162018 annual bonus payments based on adjusted diluted EPSour reported operating income of $3.48.$313.9 million. We believe EPSoperating income is the besta strong indicator of medium-term and long-term stockholder value indicator as it has had the strongesta strong long‑term correlation with our stock price over time, of any objective measurement, it is performance-based, and its use in our cash award plans supports our business goal of providing a superior return to our stockholders. Further, operating income is not impacted by tax benefits related to share-based compensation expense or recently enacted tax reform. The Compensation Committee has evaluated whether our reliance on EPSoperating income creates unnecessary risk and does not believe that it does. Indeed, as reflected in the “Executive Summary”above, the correlation between our 10-year CAGR for adjusted diluted EPS (7.2%) and stock price (10.3%) further underscores why we believe our reliance on EPS is appropriate. For each NEO, the Company financial measures are supplemented by individualized business performance metrics tailored to that officer’s unique area of responsibility. Our NEOs’ annual bonuses are also subject to a diluted EPS overlay, which means that the Compensation Committee may eliminate or limit bonus payments depending on our EPS results for the year. The metrics for all NEOs are designed to be challenging and encourage improvement over the status quo.
The annual bonus provides our CEOprovided Messrs. Perez de la Mesa, Arvan and Cook an up to 200% of salary opportunity (with a plan design of 100%) and our other NEOsMessrs. Joslin and St. Romain an up to 150% of salary opportunity (with 75% being the design), except that Ms. Neil’s maximum annual bonus opportunity is 100%a plan design of her base salary. As evidence of our commitment to pay for performance, the table below presents the average annual bonus payout as a percentage of salary for our NEOs as a group over the past five years.
|
| | | | | | |
| Fiscal Year End | | Average Annual Bonus Payout as a Percentage of Base Salary (for all NEOs as a group) | | Adjusted Diluted EPS Growth Over the Prior Year (1) |
2016(2) | | 134 | % | | 20 | % |
| 2015 | | 104 | % | | 19 | % |
| 2014 | | 94 | % | | 19 | % |
2013(2) | | 61 | % | | 11 | % |
2012(2) | | 124 | % | | 23 | % |
| |
(1)
| While EPS is the primary component of our average annual bonus payout, operational cash flow results and the achievement of other specific business objectives also impact our NEOs’ annual bonus payouts. |
| |
(2)
| The 2016 EPS growth is based on adjusted 2016 diluted EPS, which excludes a non‑cash goodwill impairment charge of $0.6 million, or $0.01 per diluted share. The 2013 and 2012 EPS growth is based on adjusted 2012 diluted EPS, which excludes a non-cash goodwill impairment charge of $6.9 million, or $0.14 per diluted share. The 2012 EPS growth is also based on adjusted 2011 diluted EPS, which excludes a non‑cash goodwill impairment charge of $1.6 million, or $0.03 per diluted share. |
75%). The table below details compensation opportunities available to each of our NEOs under various 20162018 performance scenarios. The extent to which objectives are achieved determines the award earned.
Annual Cash Performance Opportunity
(expressed as a percentage of base salary)
| | | | Diluted EPS(1) | | Operational
Cash Flow(2) | | Other
Specific
Business
Objectives(3) | | Maximum Opportunity | Operating Income(1) | | Operational
Cash Flow(2) | | Other
Specific
Business
Objectives(3) | | Maximum
Opportunity |
| | $ | 3.05 |
| $3.15 | $3.25 | $3.35 | $3.45 | $3.55 | | 80% | 95% | 105% | 110% | | $ | 294.8 |
| $ | 305.7 |
| $ | 316.6 |
| $ | 327.5 |
| $ | 338.4 |
| $ | 348.3 |
| | 80% | 95% | 105% | 110% | |
| Mr. Perez de la Mesa | 15.0 | % | 30 | % | 45.0 | % | 60 | % | 100 | % | 140 | % | | —% | 10% | 23% | 30% | | 30% | | 200% | 15.0 | % | 30 | % | 45.0 | % | 60 | % | 100 | % | 140 | % | | —% | 10% | 23% | 30% | | 30% | | 200% |
| Mr. Joslin | 12.5 | % | 25 | % | 37.5 | % | 50 | % | 75 | % | 100 | % | | —% | 5% | 10% | | 40% | | 150% | 12.5 | % | 25 | % | 37.5 | % | 50 | % | 75 | % | 100 | % | | —% | 5% | 10% | | 40% | | 150% |
| Mr. Arvan | | 15.0 | % | 30 | % | 45.0 | % | 60 | % | 100 | % | 140 | % | | —% | 10% | 23% | 30% | | 30% | | 200% |
| Mr. Cook | 10.0 | % | 20 | % | 30.0 | % | 40 | % | 60 | % | 80 | % | | —% | 5% | 10% | | 60% | | 150% | 10.0 | % | 20 | % | 30.0 | % | 40 | % | 60 | % | 80 | % | | —% | 5% | 10% | | 110% | | 200% |
| Mr. St. Romain | 10.0 | % | 20 | % | 30.0 | % | 40 | % | 60 | % | 80 | % | | —% | 5% | 10% | | 60% | | 150% | 10.0 | % | 20 | % | 30.0 | % | 40 | % | 60 | % | 80 | % | | —% | 5% | 10% | | 60% | | 150% |
| Ms. Neil | 12.5 | % | 25 | % | 37.5 | % | 50 | % | 50 | % | 50 | % | | N/A | | 50% | | 100% | |
| |
(1) | Based on our potential diluted EPSoperating income (in millions) for the year ended December 31, 2016.2018. The cash award earned is prorated based on diluted earnings per shareoperating income between $3.05$294.8 million and $3.55.$348.3 million. |
| |
(2) | Based on our net cash provided by operating activities as a percentage of net income for the year ended December 31, 2016.2018. The cash award earned is prorated based on cash provided by operating activities as a percentage of net income between 80% and 110% for Mr. Perez de la Mesa and Mr. Arvan and between 80% and 105% for Messrs. Joslin, Cook and St. Romain. In 2016, we achieved net cash provided by operations that was 111% of net income; thus, no proration was necessary. |
| |
(3) | Each executive’s respective business objectives reflects operational improvements related to his or her specific responsibilities, as described below. Certain subjective business objectives, such as organizational planning and development, are also subject to the diluted EPS overlay set forth in the table above. |
The table below presents the annual bonus earned by each NEO for 20162018 under the AIP. We believe the 20162018 actual annual bonus payouts reflected our strong performance in 2016,2018, including 20%10% operating income growth in EPS and a 30.6%16% one-year total stockholder return. These payouts also reflect the variability of our annual cash award based on performance, which is by design given that our NEOs’ base salaries are significantly below our peer group median base salary amounts. The total payouts under the annual bonus ranged from 95%57.4% to 168%95.5% of each NEO’s base salary and consisted of a calculated award of approximately 26%23.4% to 52%64.6% of base salary for the achievement of specific individual business objectives. All of the 20162018 annual cash awards were based on actual objectives achieved and the Compensation Committee did not include any additional discretionary award amounts.
| | | | | | | | Components as a % of Base Salary | | | | | Components as a % of Base Salary |
| | Annual Bonus Earned | | Bonus as a Percentage of Base Salary | | Adjusted Diluted EPS(1) | | Operational Cash Flow(2) | | Other Specific Business Objectives(3) | Annual Bonus Earned | | Bonus as a Percentage of Base Salary | | Operating Income(1) | | Operational Cash Flow(2) | | Other Specific Business Objectives(3) |
| Mr. Perez de la Mesa | $ | 806,400 |
| | 168.0 | % | | 112.0 | % | | 30.0 | % | | 26.0 | % | $ | 356,661 |
| | 71.3 | % | | 41.2 | % | | 6.7 | % | | 23.4 | % |
| Mr. Joslin | 355,725 |
| | 127.5 | % | | 82.5 | % | | 10.0 | % | | 35.0 | % | 202,737 |
| | 68.7 | % | | 34.4 | % | | 3.3 | % | | 31.0 | % |
| Mr. Arvan | | 313,862 |
| | 71.3 | % | | 41.2 | % | | 6.7 | % | | 23.4 | % |
| Mr. Cook | 343,140 |
| | 114.0 | % | | 66.0 | % | | 10.0 | % | | 38.0 | % | 302,637 |
| | 95.5 | % | | 27.6 | % | | 3.3 | % | | 64.6 | % |
| Mr. St. Romain | 370,620 |
| | 127.8 | % | | 66.0 | % | | 10.0 | % | | 51.8 | % | 177,886 |
| | 57.4 | % | | 27.6 | % | | 3.3 | % | | 26.5 | % |
| Ms. Neil | 180,500 |
| | 95.0 | % | | 50.0 | % | | N/A |
| | 45.0 | % | |
| |
(1) | We achieved diluted EPSoperating income of $3.47$313.9 million for the year ended December 31, 2016; adjusted diluted EPS was $3.48 for the year. During the third quarter of 2016, we recorded a non-cash goodwill impairment charge of $0.6 million, which had an impact of $0.01 per diluted share.2018. |
| |
(2) | Net cash provided by operations was 111%51% of net income for the year ended December 31, 2016.2018. For the purpose of determining the achievement of the operational cash flow measure, the Compensation Committee authorized the use of adjusted net cash provided by operations, which excludes the timing difference from pre-price increase inventory purchases executed in the last half of 2018; adjusted cash flows from operations was 90% of net income. |
| |
(3) | Each of the NEO’s respective business objectives reflects our focus on continued growth and improvement in execution over our past performance. In each case, these objectives represent stretch goals that each executive may or may not be able to achieve. The table below describes each NEO’s other specific business objectives, the bonus opportunity as a percentage of base salary for each, and the payout level achieved as a percentage of base salary for each. |
| | Other Specific Business Objectives by NEO | | | | | | | | | | | | |
| Objective | Objective | | Opportunity | | Achievement | Objective | | Opportunity | | Achievement |
| Mr. Perez de la Mesa | Mr. Perez de la Mesa | | | | | Mr. Perez de la Mesa | | | | |
| | § return on invested capital | | 10.0 | % | | 10.0 | % | § return on invested capital | | 10.0 | % | | 3.4 | % |
| | § organizational planning and development | | 10.0 | % | | 10.0 | % | § organizational planning and development | | 10.0 | % | | 10.0 | % |
| | § strategic projects | | 10.0 | % | | 6.0 | % | § executive management development | | 10.0 | % | | 10.0 | % |
| | | 30.0 | % | | 26.0 | % | | 30.0 | % | | 23.4 | % |
| | | | | | | | | |
| Mr. Joslin | Mr. Joslin | | | | | Mr. Joslin | | | | |
| | § expense management and profitability improvement | | 15.0 | % | | 15.0 | % | § expense management and profitability improvement | | 15.0 | % | | 7.0 | % |
| | § strategic projects | | 20.0 | % | | 15.0 | % | § strategic projects | | 20.0 | % | | 19.0 | % |
| | § credit and collections initiatives | | 5.0 | % | | 5.0 | % | § credit and collections initiatives | | 5.0 | % | | 5.0 | % |
| | | 40.0 | % | | 35.0 | % | | 40.0 | % | | 31.0 | % |
| | | | | | | | | |
| Mr. Arvan | | Mr. Arvan | | | | |
| | | § return on invested capital | | 10.0 | % | | 3.4 | % |
| | | § organizational planning and development | | 10.0 | % | | 10.0 | % |
| | | § executive management development | | 10.0 | % | | 10.0 | % |
| | | | 30.0 | % | | 23.4 | % |
| | | | | | |
| Mr. Cook | Mr. Cook | | | | | Mr. Cook | | | | |
| | | § group profit | | 90.0 | % | | 50.8 | % |
| | § group profit | | 40.0 | % | | 25.7 | % | § working capital management | | 10.0 | % | | 7.5 | % |
| | § working capital management | | 10.0 | % | | 7.5 | % | § strategic sourcing | | 5.0 | % | | 5.0 | % |
| | § strategic sourcing | | 5.0 | % | | 4.8 | % | § gross margin | | 2.5 | % | | 1.3 | % |
| | § gross margin | | 5.0 | % | | — | % | § employee attrition reduction | | 2.5 | % | | — | % |
| | | 60.0 | % | | 38.0 | % | | 110.0 | % | | 64.6 | % |
| | | | | | | | | |
| Mr. St. Romain | Mr. St. Romain | | | | | Mr. St. Romain | | | | |
| | § group profit | | 40.0 | % | | 36.8 | % | § group profit | | 40.0 | % | | 16.5 | % |
| | § working capital management | | 10.0 | % | | 7.5 | % | § working capital management | | 10.0 | % | | 7.5 | % |
| | § packaged pool product management | | 5.0 | % | | 2.5 | % | § packaged pool product management | | 5.0 | % | | 2.5 | % |
| | § gross margin | | 5.0 | % | | 5.0 | % | § gross margin | | 2.5 | % | | — | % |
| | | 60.0 | % | | 51.8 | % | § employee attrition reduction | | 2.5 | % | | — | % |
| | | | | | | 60.0 | % | | 26.5 | % |
| Ms. Neil | | | | | |
| | § strategic projects and organizational support | | 25.0 | % | | 20.0 | % | | | | |
| | § corporate governance and compliance | | 10.0 | % | | 10.0 | % | |
| | § litigation management | | 10.0 | % | | 10.0 | % | |
| | § safety and workplace training | | 5.0 | % | | 5.0 | % | |
| | | 50.0 | % | | 45.0 | % | |
| | | | | | |
The following table below presents the percentage variances between our NEOs’ annual cash award amounts (2016(2018 actual and 20162018 plan design) and the peer group median annual cash award amounts, which reflect 20142016 or 20152017 annual cash awards based on publicly available information as of February 20162018 when the Compensation Committee set our 2016 compensation:2018 compensation.
| | Annual Cash Award Above (Below) Peer Group Medians | Annual Cash Award Above (Below) Peer Group Medians | Annual Cash Award Above (Below) Peer Group Medians |
| Position | | 2016 Actual | | 2016 Plan Design | | 2018 Actual | | 2018 Plan Design |
| CEO | | 11 | % | | (34 | )% | | (47 | )% | | (26 | )% |
| All Other NEOs | | 26 | % | | (20 | )% | | 23 | % | | 50 | % |
| Total NEOs | | 19 | % | | (26 | )% | | (8 | )% | | 16 | % |
Medium-Term Cash Award
(Summary Compensation Table, Column 6)
(Grants of Plan-Based Awards, Columns 3-4)
The Compensation Committee adopted the SPIP which our stockholders last approved in 2016, to provide senior management with an additional performance-based award based upon the achievement of specified earnings objectives. The SPIP is a cash-based, pay‑for‑performance award program that links our medium-term financial performance with the total cash compensation paid to senior management. The SPIP serves to complement our annual bonus program and the longer-term value creation potential provided by equity awards. Since the SPIP ties a large percentage of total potential compensation directly to our business results, the Compensation Committee believes this program underscores our pay‑for‑performance philosophy and helps focus executive attention on longer-term strategic goals.
Payouts through the SPIP are based on the three-year compoundedcompound annual growth rate (CAGR) of our diluted EPS. As previously noted, weWe believe EPS growth is one of the metricmetrics that has shown the greatesta strong correlation with our stock price growth over the long term. The Compensation Committee believes that while the SPIP targets are aggressive, they are reasonable and provide both a fair reward and strong upside potential for our executives. The Compensation Committee may authorize EPS adjustments as specified by the SPIP and consistent with the requirements of Section 162(m) of the Internal Revenue Code. For the 2016 annual bonus payout, the Compensation Committee authorized the use of adjusted diluted EPS in measuring performance, and consistent with that approach, the adjusted diluted EPS will serve as the baseline for the new performance period beginning January 1, 2017 and ending December 31, 2019.
Under the terms of the SPIP, our NEOs are eligible to earn a maximum cash award of up to 200% of their base salary, with minimum targets based on a three-year EPS CAGR of 10%. The Compensation Committee may authorize EPS adjustments as specified under the SPIP. By way of example, the following table below presents the award, expressed as a percentage of an NEO’s salary, to be earned for the three-year performance period beginning January 1, 20162018 and ending December 31, 2020. For this 2018 with agrant, 2017 adjusted diluted EPS of $3.99 serves as the baseline for the performance period, except that the Compensation Committee further considered the impact going forward of the lower tax rate under the TCJA and therefore increased the baseline EPS to $4.74, thereby increasing the rigor of $2.90, which was our diluted EPS for 2015:the award.
| | | CAGR | 2018 EPS | Salary % | | CAGR | 2018 EPS | Salary % | 2020 EPS | Salary % | | CAGR | 2020 EPS | Salary % |
| 10% |
| $3.86 |
| 50% | | 16% |
| $4.53 |
| 120% |
| $6.31 |
| 50% | | 16% |
| $7.40 |
| 120% |
| 11% | 3.97 |
| 60% | | 17% | 4.64 |
| 140% | 6.48 |
| 60% | | 17% | 7.59 |
| 140% |
| 12% | 4.07 |
| 70% | | 18% | 4.76 |
| 160% | 6.66 |
| 70% | | 18% | 7.79 |
| 160% |
| 13% | 4.18 |
| 80% | | 19% | 4.89 |
| 180% | 6.84 |
| 80% | | 19% | 7.99 |
| 180% |
| 14% | 4.30 |
| 90% | | 20% | 5.01 |
| 200% | 7.02 |
| 90% | | 20% | 8.19 |
| 200% |
| 15% | 4.41 |
| 100% | | | | 7.21 |
| 100% | | | |
The following table presents our three-year EPS CAGR and corresponding payouts as a percentage of base salaries for each of the last three fiscal years.
|
| | | | | | | |
Three-Year Performance Period | | SPIP Payout as a Percentage of NEO Base Salaries | | Three-Year EPS CAGR | |
January 1, 2014 - December 31, 2016 (1) | | 186.0 | % | | 19.3 | % | |
January 1, 2013 - December 31, 2015 (2) | | 123.3 | % | | 16.2 | % | |
January 1, 2012 - December 31, 2014 (3) | | 168.0 | % | | 17.6 | % | |
|
| | | | | | | |
Three-Year Performance Period | | SPIP Payout as a Percentage of NEO Base Salaries (1) | | Three-Year EPS CAGR | |
January 1, 2016 - December 31, 2018 (2) | | 101.6 | % | | 15.1 | % | |
January 1, 2015 - December 31, 2017 (3) | | 156.0 | % | | 17.8 | % | |
January 1, 2014 - December 31, 2016 (4) | | 186.0 | % | | 19.3 | % | |
| |
(1) | We calculatedMr. Arvan joined our company in January 2017 and was not a participant in the 3-year CAGR using adjusted 2016 diluted EPS, which excludesSPIP for the performance period ended December 31, 2017; he did receive a non-cash goodwill impairment charge of $0.6 million, or $0.01 per diluted share.pro‑rated payout for the performance period ended December 31, 2018. |
| |
(2) | The baselineWe calculated the three-year EPS for this performance period reflectsCAGR using 2018 adjusted 2012 diluted EPS, which excludes a non-cash goodwill impairment charge of $6.9 million, or $0.14$1.20 per diluted share.share benefit from the lower federal tax rate under the TCJA and the tax benefit from ASU 2016-09. |
| |
(3) | The baselineWe calculated the three-year EPS for this performance period reflectsCAGR using 2017 adjusted 2011 diluted EPS, which excludes a $0.28 per diluted share benefit from the impact of the TCJA and a $0.24 per diluted share benefit from the impact of ASU 2016-09. |
| |
(4) | We calculated the three-year EPS CAGR using 2016 adjusted diluted EPS, which excludes a $0.01 per diluted share impact of a non-cash goodwill impairment charge of $1.6 million, or $0.03 per diluted share.charge. |
The following table presents SPIP awards with open performance periods as of January 1, 2017:2019:
| | | Grant Year | | Three-Year Performance Period | | Baseline EPS | | Minimum EPS for Payout (10% CAGR) | | Maximum EPS for Payout (20% CAGR) | | Three-Year Performance Period | | Baseline EPS (1) | | Minimum EPS for Payout (10% CAGR) | | Maximum EPS for Payout (20% CAGR) |
| 2015 | | January 1, 2015 - December 31, 2017 | |
| $2.44 |
| |
| $3.25 |
| |
| $4.22 |
| |
| 2016 | | January 1, 2016 - December 31, 2018 | |
| $2.90 |
| |
| $3.86 |
| |
| $5.01 |
| |
| 2017 | | January 1, 2017 - December 31, 2019 | |
| $3.48 |
| |
| $4.63 |
| |
| $6.01 |
| | January 1, 2017 - December 31, 2019 | |
| $3.48 |
| |
| $4.63 |
| |
| $6.01 |
|
| 2018 | | | January 1, 2018 - December 31, 2020 | |
| $4.74 |
| |
| $6.31 |
| |
| $8.19 |
|
| 2019 | | | January 1, 2019 - December 31, 2021 | |
| $5.26 |
| |
| $7.00 |
| |
| $9.09 |
|
| |
(1) | For the 2017 grant, 2016 adjusted diluted EPS of $3.48 serves as the baseline for the performance period. For the 2018 grant, 2017 adjusted diluted EPS of $3.99 serves as the baseline for the performance period, except that the Compensation Committee further considered the impact going forward of the lower tax rate under the TCJA and therefore increased the baseline EPS to $4.74, thereby increasing the rigor of the award. For the 2019 grant, the Compensation Committee set the baseline EPS at $5.26 per diluted share, which excludes a $0.36 per diluted share benefit from ASU 2016-09 from 2018 diluted EPS. |
Long-Term Equity Award
(Summary Compensation Table, Columns 4-5)
(Grants of Plan-Based Awards, Columns 5-8)
(Outstanding Equity Awards at Fiscal Year-End)
Equity grants are a key element of our total compensation package. Our approach to long-term equity awards to our NEOs consists of stock options and restricted stock awards, both of which provide retention value through the imposition of cliff vesting conditions. InBeginning in 2016, in an effort to place an even greater emphasis on performance, the Compensation Committee granted performance‑based restricted stock awards to our NEOs. While still subject to time-based cliff vesting conditions, these awards are further subjected to performance-based vesting criteria as discussed in more detail below.
We determineThe Compensation Committee determines individual equity grant awards based on relevant market data and each respective employee’s responsibility and performance. We believe that long-term equity awards in the form of stock options align executive performance with stockholder interests because employees have a vested interest in our stock performance and the option’s value only appreciates from stock price improvement after the grant date. Similarly, we believe that restricted stock awards reward performance because the ultimate value of the shares depends upon our Company’s long-term performance. Restricted stock awards convey all the rights of a stockholder, including the right to vote and receive dividends, but recipients may not sell or transfer the shares until they are fully vested. The Compensation Committee believes that in times of economic volatility, restricted stock awards can play an important role in retention and motivation that stock options alone cannot.
We use the following service-based equity vesting schedules to encourage employee equity holding and employment retention:
|
| | |
| Employee’s Length of Service to the Company | | Award Vesting Schedule |
| Less than five years | | 100% vest five years after the grant date |
| More than five years | | 50% vest three years after the grant date 50% vest five years after the grant date |
Beginning with the 2016 equity grants, restricted stock awards to our employees contain performance-based criteria in addition to the service-based vesting criteria discussed above. The timing of theawards provide for a three-year performance period aligns withfor the service period, as the performance metric mayto be achieved in any consecutive three-year period during the three/five-year service-based vesting period. By way of example, for restricted stock awards granted in 2016, the performance metric may be achieved in any consecutive three-year period beginning January 1, 2016 through December 31, 2020.achieved. If the performance metric fails to be met, the performance period may be extended; however, if the metric is not met by the end of the extended performance period, ending December 31, 2020, then all shares of performance-based restricted stock will be immediately forfeited and canceled for these grants.
Under the performance-based vesting criteria for restricted stock awards granted in 2016,2018, these shares will vest based on our achievement of a three-year 10% ROIC target of 10% established at the beginning of the performance period. We believe ROIC is an important indicator of financial health and company growth and is consistent with our compensation philosophy that compensation must be linked to continuous improvements in corporate performance. Further, after reviewing our peer companies’ proxy statements, we noted that ROIC was among the most widely used of the financial metrics for performance-based compensation. For more information on our ROIC calculation and 20162018 results, please see the “Annual Incentive Plan” section above.
In 2016,2018, the Compensation Committee allowed each of the NEOs to elect to receive his or her equity grant in the form of performance-basedperformance‑based restricted stock awards, stock options, or some reasonable combination of the two. The Compensation Committee believes that both stock options and restricted stock awards are closely aligned with the interests of stockholders and by offering our NEOs this choice, it serves our objectives of retention and motivation. Mr. Perez de la Mesa elected to receive 50% of his equity award in performance-basedas performance‑based restricted stock awards and 50% inas stock options. Messrs. Joslin, Arvan, Cook Joslin,and St. Romain and Ms. Neil each elected to receive 100% of their respective equity awards in the form of performance-based restricted stock awards.
In determining the above awards, we used a ratio of 2.5 stock options to 1.0 restricted share. By way of example, Mr. Perez de la Mesa was entitled to receive 60,000 stock option equivalents. He could have elected to receive either 60,000 stock options, 24,000 restricted stock awards, or a combination of the two forms of equity. Mr. Perez de la Mesa chose to receive his 2016 equity grant in the form of 50% stock options and 50% restricted stock awards, which resulted in an award of 30,000 stock options and 12,000 restricted stock awards. This 2.5 to 1.0 ratio reflects the Compensation Committee’s estimate of equivalent fair value amounts for stock options and restricted stock awards. This estimate is based on the average of a range of fair value estimates for stock option awards, assuming that the stock options would have an expected term of 10 years (held for the full contractual term) and an estimated dividend yield rate of 1.5%. By way of example, Mr. Perez de la Mesa was entitled to receive 36,000 stock option equivalents. He could have elected to receive either 36,000 stock options, 14,400 restricted stock awards, or a combination of the two forms of equity. Mr. Perez de la Mesa chose to receive his 2018 equity grant in the form of 50% stock options and 50% restricted stock awards, which resulted in an award of 18,000 stock options and 7,200 restricted stock awards.
Based on the total grant date fair value of equity-based awards granted in 2016,2018, the equity-based awards granted to our CEO, Mr. Perez de la Mesa as CEO were slightly more than 3.0approximately 1.8 times the average total fair value of the equity-based awards to our other NEOs in recognition of his substantially greater responsibilities. Mr. Perez de la Mesa’s duties and responsibilities encompassencompassed all aspects of our management and operations and arewere greater in scope and collectively more significant in nature than those of our other NEOs. Based on the 20162018 equity grants and as noted in the table below, our CEO’s 20162018 total equity compensation was in line with the peer group median for the most recent fiscal year reported.
The table below presents the percentage variances between our 20162018 actual total equity compensation amounts and the peer group median total equity compensation amounts. As previously discussed, all stock option awards are valued based on the number of stock options awarded multiplied by 40% of the closing stock price on the grant date (assuming this price equals theoption’s exercise price).price.
|
| | | |
Total Equity Compensation Above (Below) Peer Group Medians(1) |
| Position | | 20162018
Actual |
| CEO | | 5(32 | )% |
| All Other NEOs | | 1465 | % |
| Total NEOs | | 1012 | % |
| |
(1) | Our Compensation Committee granted equity awards for fiscal 2018 in February 2018. At that time, peer group compensation data for 2017 was not available. Therefore, the peer group median amounts used for comparison in the above table were calculated primarily using 2016 compensation data. |
Currently, the Compensation Committee grants equity awards at their first meeting of the year, which is normally held in February. This annual grant coincides with the annual performance review and compensation adjustment cycle. Stock options are granted at an exercise price equal to our stock’s closing price on the grant date. The Compensation Committee may also grant equity awards to employees hired during the year. As an employee’s responsibility increases, equity grants become a greater percentage of his or her total compensation, equating to more at-risk compensation for higher level employees.
Stock Ownership Guidelines
The Compensation Committee believes that our executives and directors should have a significant equity interest in the Company to create an owner’s perspective in managing our Company and to further align their interests and actions with the interests of our stockholders. Since 2009, ourOur Board has maintainedmaintains stock ownership guidelines that generally require within five years of appointment, our NEOs and directors hold shares of Common Stock or stock equivalents with a market value as follows:
|
| | |
| Position | | Equity Ownership Guidelines |
| CEO | | 5x base salary |
| Vice presidents | | 2x base salary |
| Directors (other than the CEO) | | 3x annual cash retainer |
The Compensation Committee reviews compliance with the stock ownership guidelines annually, and all NEOs and directors are presently in compliance with the guidelines.
Retirement and Savings Plans
(Summary Compensation Table, Column 7)
(Nonqualified Deferred Compensation)
The Pool Corporation 401(k) Plan (the 401(k) Plan), which is generally available to both management and non-management personnel, allows eligible employees to defer eligible compensation up to the Internal Revenue Code limit. For 2016,2018, the limit was $18,000,$18,500, or $24,000$24,500 for participants who attained the age of 50 during the plan year. We contribute a 100% match on the first 3% of eligible compensation deferred, a 50% match on deferrals between 3% and 5% and no match on deferrals over 5%.
The PoolCorp Nonqualified Deferred Compensation Plan (the Deferred Compensation Plan) allows certain employees who occupy key management positions (including all of the NEOs) to defer eligible cash compensation and enables participants to receive matching contributions on the same percentage of eligible compensation as offered under the 401(k) Plan. Our total Company matching contributions given to a participant under the 401(k) Plan and the Deferred Compensation Plan during any one year may not exceed 4% of a participant’s eligible cash compensation. The purpose of the Deferred Compensation Plan is to make total retirement benefits for our employees who earn over the qualified plan limits commensurate with those available to other employees as a percentage of pay.
We do not provide any defined benefit pension arrangements nor do we provide any other compensation arrangements to our NEOs other than those discussed in this proxy statement or available to all Company employees.
Perquisites
(Summary Compensation Table, Column 7)
Our philosophy is that perquisites should be limited. In line with this philosophy, our executives are offered few benefits that are not generally available to all of our employees. We provide certain employees, including the NEOs, with a company vehicle, including maintenance, insurance and fuel. We allow these employees to use their vehicles for personal and business reasons. Officers may choose to purchase their company vehicle at book value at any point. Additionally, we waive medical and dental monthly premiums for officers, including each of the NEOs. The Company does not own any aircraft or have any contract for air charter service and does not reimburse NEOs for club or like memberships. Excluding benefits available to all full‑time employees, NEO benefits and other compensation represents less than 3%represent approximately 3.5% of the NEO total compensation in the aggregate.
Other Compensation Matters
Post-Employment Matters
Under Mr. Perez de la Mesa’sArvan’s employment agreement, if the Company terminates his employment other than for cause he will receive his base salary for a period of six months. In the event Mr. Arvan’s employment is terminated before his 2017 and 2018 equity awards vest, he will retain a pro rata share of such grants. The agreement also provides that Mr. Perez de la MesaArvan may not compete with the Company for two years following the termination of his employment. TheOur other NEOs have also signed employment agreements, which entitle them to receive their respective base salaries for a period of three months if terminated for reasons other than cause, and which prevent them from competing with the Company for one year following such termination.
The Compensation Committee believes these provisions are necessary to recruit highly talented executives and are conservative considering current market conditions and competing businesses. Further, the Compensation Committee believes that these post-employmentpost‑employment payment levels are below the general practice among comparable companies. Our NEOs are not entitled to any change of control or “parachute” payments or benefits other than accelerated vesting of their outstanding equity awards in the case of a qualifying termination within two years of a change of control as further described in the “Potential Payments Upon Termination of Employment or Change of Control” section of our Executive Compensation discussion.
Certain Tax Considerations
Under Section 162(m) of the Internal Revenue Code (Section 162(m)), public companies may generally not take a tax deduction for compensation in excess of $1.0 million paid to certain executive officers, including a company’s chief executive officer or any of the next three most highly compensated officers other than the chief financial officer. If compensation qualifies as “performance-based” under Section 162(m), it does not count against the $1.0 million deduction limit.
In 2016, our stockholders approved our AIP, our Amended and Restated 2007 Long-Term Incentive Plan and our SPIP, in part to make awards under these plans eligible for qualification as “performance-based” for purposes of the deductibility limitations. Our policy with respect to Section 162(m) is to make reasonable efforts to ensure that compensation is deductible without limiting our ability to attract and retain qualified executives. The Compensation Committee has not adopted a policy that all compensation must be deductible, believing in the importance of retaining flexibility to design compensation programs that recognize a full range of criteria important to our success, even where compensation payable under the programs may not be fully deductible. Our Compensation Committee intends to monitor compensation levels and the deduction limitation.
REPORT OF THE COMPENSATION COMMITTEE
OF THE BOARD OF DIRECTORS OF POOL CORPORATION
FOR THE YEAR ENDED DECEMBER 31, 20162018
The Compensation Committee of the Board of Directors has reviewed and discussed with management the Company’s Compensation Discussion and Analysis set forth above and based on that review and discussion has recommended to the Board of Directors that such Compensation Discussion and Analysis be incorporated by reference in the Company’s Annual Report on Form 10-K and included in this Proxy Statement.
COMPENSATION COMMITTEE
Harlan F. Seymour, Chairman
Andrew W. Code
Robert C. Sledd
The Compensation Committee Report shall not be deemed incorporated by reference by any general statement incorporating by reference this Proxy Statement into any filing under the Securities Act of 1933 or under the Exchange Act, except to the extent that we specifically incorporate this information by reference, and shall not be deemed filed under such Acts.
EXECUTIVE COMPENSATION
The Summary Compensation Table below summarizes the total compensation of our NEOs in 2016.2018. Based on the totals of the amounts included in the 20162018 Summary Compensation Table, base salary accounted for approximately 14%17% of the total compensation for the NEOs while our annual and medium-term cash awards accounted for approximately 44%27% of the total compensation for the NEOs. As discussed in our “Compensation Philosophy and Objectives” in the CD&A above, our NEOs have a larger proportion of their total compensation opportunity delivered through pay-for-performance cash awards and long-term equity. For example, our CEO, Mr. Perez de la Mesa, our CEO during 2018, had the largest proportion of total compensation delivered through pay-for-performance cash awards and long-term equity compensation.
FISCAL 20162018 SUMMARY COMPENSATION TABLE
| | Name and Principal Position | | Year | | Salary | | Stock
Awards (1) | | Option Awards (2) | | Non-Equity Incentive Plan Compensation (3) | | All Other Compensation (4) | | Total | | Year | | Salary | | Stock
Awards (2) | | Option Awards (3) | | Non-Equity Incentive Plan Compensation (4) | | All Other Compensation (5) | | Total |
| Manuel J. Perez de la Mesa | | 2016 | | $ | 480,000 |
| | $ | 1,050,360 |
| | $ | 859,650 |
| | $ | 1,698,357 |
| | $ | 89,151 |
| | $ | 4,177,518 |
| | 2018 | | $ | 500,000 |
| | $ | 993,816 |
| | $ | 809,460 |
| | $ | 864,879 |
| | $ | 114,310 |
| | $ | 3,282,465 |
|
| President and Chief | | 2015 | | 470,000 |
| | 1,047,750 |
| | 959,438 |
| | 1,167,013 |
| | 91,238 |
| | 3,735,439 |
| | 2017 | | 490,000 |
| | 1,053,360 |
| | 957,600 |
| | 1,244,600 |
| | 114,215 |
| | 3,859,775 |
|
| Executive Officer | | 2014 | | 460,000 |
| | 873,900 |
| | 835,500 |
| | 1,274,345 |
| | 122,737 |
| | 3,566,482 |
| | 2016 | | 480,000 |
| | 1,050,360 |
| | 859,650 |
| | 1,698,357 |
| | 89,151 |
| | 4,177,518 |
|
| Mark W. Joslin | | 2016 | | 279,000 |
| | 727,020 |
| | — |
| | 874,175 |
| | 59,605 |
| | 1,939,800 |
| | 2018 | | 295,000 |
| | 828,180 |
| | — |
| | 502,586 |
| | 67,456 |
| | 1,693,222 |
|
| Senior Vice President and | | 2015 | | 272,000 |
| | 698,500 |
| | — |
| | 620,978 |
| | 60,237 |
| | 1,651,715 |
| | 2017 | | 287,000 |
| | 877,800 |
| | — |
| | 668,796 |
| | 90,148 |
| | 1,923,744 |
|
| Chief Financial Officer | | 2014 | | 265,000 |
| | 582,600 |
| | — |
| | 689,879 |
| | 59,796 |
| | 1,597,275 |
| | 2016 | | 279,000 |
| | 727,020 |
| | — |
| | 874,175 |
| | 59,605 |
| | 1,939,800 |
|
| Peter D. Arvan | | | 2018 | | 440,000 |
| | 1,518,330 |
| | — |
| | 537,478 |
| | 60,180 |
| | 2,555,988 |
|
| Executive Vice President and | | | 2017 | | 400,000 |
| | 1,500,014 |
| | — |
| | 337,960 |
| | 36,979 |
| | 2,274,953 |
|
| Chief Operating Officer | | | | | | | | | | | | | |
| A. David Cook | | 2016 | | 301,000 |
| | 727,020 |
| | — |
| | 902,471 |
| | 49,418 |
| | 1,979,909 |
| | 2018 | | 317,000 |
| | 828,180 |
| | — |
| | 624,847 |
| | 70,586 |
| | 1,840,613 |
|
| Group Vice President | | 2015 | | 295,000 |
| | 698,500 |
| | — |
| | 645,167 |
| | 67,829 |
| | 1,706,496 |
| | 2017 | | 307,000 |
| | 877,800 |
| | — |
| | 756,141 |
| | 73,321 |
| | 2,014,262 |
|
| | | 2014 | | 289,000 |
| | 582,600 |
| | — |
| | 769,120 |
| | 90,330 |
| | 1,731,050 |
| | 2016 | | 301,000 |
| | 727,020 |
| | — |
| | 902,471 |
| | 49,418 |
| | 1,979,909 |
|
| Kenneth G. St. Romain | | 2016 | | 290,000 |
| | 727,020 |
| | — |
| | 909,510 |
| | 68,927 |
| | 1,995,457 |
| | 2018 | | 310,000 |
| | 828,180 |
| | — |
| | 492,981 |
| | 81,217 |
| | 1,712,378 |
|
| Group Vice President | | 2015 | | 280,000 |
| | 523,875 |
| | 159,906 |
| | 610,402 |
| | 70,373 |
| | 1,644,556 |
| | 2017 | | 300,000 |
| | 877,800 |
| | — |
| | 682,800 |
| | 83,352 |
| | 1,943,952 |
|
| | | 2014 | | 270,000 |
| | 436,950 |
| | 139,250 |
| | 652,945 |
| | 64,181 |
| | 1,563,326 |
| | 2016 | | 290,000 |
| | 727,020 |
| | — |
| | 909,510 |
| | 68,927 |
| | 1,995,457 |
|
| Jennifer M. Neil | | 2016 | | 190,000 |
| | 290,808 |
| | — |
| | 533,566 |
| | 51,188 |
| | 1,065,562 |
| |
| Corporate Secretary and | | 2015 | | 185,000 |
| | 125,730 |
| | 96,345 |
| | 394,606 |
| | 52,419 |
| | 854,100 |
| |
| General Counsel | | | | | | | | | | | | | |
| |
(1) | Mr. Perez de la Mesa retired from his position as president and CEO effective December 31, 2018; the Board appointed Mr. Arvan as president and CEO effective January 1, 2019. |
| |
(2) | Amounts shown do not reflect compensation actually received by the NEOs. Instead, these amounts reflect the total estimated grant date fair value for the stock awards, which is based on the closing price of our Common Stock on the date of grant in accordance with Financial Accounting Standards Board (FASB) Accounting Standards Codification (ASC) |
Topic 718. For more information on the stock grants awarded to our NEOs in 2016,2018, please see the Fiscal 20162018 Grants of Plan-Based Awards table below.
| |
(2)(3)
| Amounts shown do not reflect compensation actually received by the NEOs. Instead, these amounts reflect the total estimated grant date fair value for option awards, determined using the Black-Scholes option valuation method in accordance with FASB ASC Topic 718. Information related to assumptions used in the calculation of the estimated fair value of option awards granted in 2014, 20152016, 2017 and 20162018 are included in footnoteNote 6 to our audited financial statements included in Item 8 of our Annual Report on Form 10-K for the fiscal year ended December 31, 20162018 filed with the SEC on February 24, 2017.27, 2019. |
| |
(3)(4)
| The amounts for each NEO consist of payouts under our annual cash performance award program and our SPIP, as set forth below: |
| | | Name | | Year | | Annual Cash Performance Award | | SPIP Payout | | Year | | Annual Cash Performance Award | | SPIP Payout |
| Mr. Perez de la Mesa | | 2016 | | $ | 806,400 |
| | $ | 891,957 |
| | 2018 | | $ | 356,661 |
| | $ | 508,218 |
|
| | | 2015 | | 587,500 |
| | 579,513 |
| | 2017 | | 480,200 |
| | 764,400 |
|
| | | 2014 | | 501,400 |
| | 772,945 |
| | 2016 | | 806,400 |
| | 891,957 |
|
| Mr. Joslin | | 2016 | | 355,725 |
| | 518,450 |
| | 2018 | | 202,737 |
| | 299,849 |
|
| | | 2015 | | 285,600 |
| | 335,378 |
| | 2017 | | 221,076 |
| | 447,720 |
|
| | | 2014 | | 244,595 |
| | 445,284 |
| | 2016 | | 355,725 |
| | 518,450 |
|
| Mr. Arvan | | | 2018 | | 313,862 |
| | 223,616 |
|
| | | | 2017 | | 337,960 |
| | — |
|
| Mr. Cook | | 2016 | | 343,140 |
| | 559,331 |
| | 2018 | | 302,637 |
| | 322,210 |
|
| | | 2015 | | 281,430 |
| | 363,737 |
| | 2017 | | 277,221 |
| | 478,920 |
|
| | | 2014 | | 283,509 |
| | 485,611 |
| | 2016 | | 343,140 |
| | 559,331 |
|
| Mr. St. Romain | | 2016 | | 370,620 |
| | 538,890 |
| | 2018 | | 177,886 |
| | 315,095 |
|
| | | 2015 | | 265,160 |
| | 345,242 |
| | 2017 | | 214,800 |
| | 468,000 |
|
| | | 2014 | | 199,260 |
| | 453,685 |
| | 2016 | | 370,620 |
| | 538,890 |
|
| Ms. Neil | | 2016 | | 180,500 |
| | 353,066 |
| |
| | | 2015 | | 166,500 |
| | 228,106 |
| |
| |
(4)(5)
| For details of the components of this category, please see the following All Other Compensation Table below. |
ALL OTHER COMPENSATION TABLE
The following table describes the components of the All Other Compensation column of the Summary Compensation Table.
| | | Name | | Year | | Company Matching Contributions to Defined Contribution Plans | | Vehicle (1) | | Other | | Year | | Company Matching Contributions to Defined Contribution Plans | | Vehicle (1) | | Other (2) |
| Mr. Perez de la Mesa | | 2016 | | $ | 65,513 |
| | $ | 14,386 |
| | $ | 9,252 |
| | 2018 | | $ | 69,776 |
| | $ | 33,194 |
| | $ | 11,340 |
|
| | | 2015 | | 70,485 |
| | 14,535 |
| | 6,218 |
| | 2017 | | 87,526 |
| | 14,379 |
| | 12,310 |
|
| | | 2014 | | 75,288 |
| | 41,134 |
| | 6,315 |
| | 2016 | | 65,513 |
| | 14,386 |
| | 9,252 |
|
| Mr. Joslin | | 2016 | | 37,646 |
| | 12,539 |
| | 9,420 |
| | 2018 | | 38,546 |
| | 15,437 |
| | 13,473 |
|
| | | 2015 | | 38,885 |
| | 12,935 |
| | 8,417 |
| | 2017 | | 56,810 |
| | 19,846 |
| | 13,492 |
|
| | | 2014 | | 38,256 |
| | 15,236 |
| | 6,304 |
| | 2016 | | 37,646 |
| | 12,539 |
| | 9,420 |
|
| Mr. Arvan | | | 2018 | | 31,088 |
| | 17,471 |
| | 11,621 |
|
| | | | 2017 | | 14,770 |
| | 13,537 |
| | 8,672 |
|
| Mr. Cook | | 2016 | | 20,594 |
| | 21,564 |
| | 7,260 |
| | 2018 | | 42,918 |
| | 13,633 |
| | 14,035 |
|
| | | 2015 | | 43,011 |
| | 17,845 |
| | 6,973 |
| | 2017 | | 48,374 |
| | 14,585 |
| | 10,362 |
|
| | | 2014 | | 42,067 |
| | 42,808 |
| | 5,455 |
| | 2016 | | 20,594 |
| | 21,564 |
| | 7,260 |
|
| Mr. St. Romain | | 2016 | | 35,794 |
| | 19,628 |
| | 13,505 |
| | 2018 | | 39,704 |
| | 26,117 |
| | 15,396 |
|
| | | 2015 | | 37,736 |
| | 20,527 |
| | 12,110 |
| | 2017 | | 48,373 |
| | 19,420 |
| | 15,559 |
|
| | | 2014 | | 36,679 |
| | 20,052 |
| | 7,450 |
| | 2016 | | 35,794 |
| | 19,628 |
| | 13,505 |
|
| Ms. Neil | | 2016 | | 23,239 |
| | 21,221 |
| | 6,728 |
| |
| | | 2015 | | 26,257 |
| | 17,316 |
| | 8,846 |
| |
| |
(1) | Reflects amounts related to vehicle depreciation, maintenance and insurance expenses for vehicles provided to the NEOs, which may be used for both business and personal purposes. Mr. Perez de la Mesa’s 20142018 total includes $26,000$23,399 in other compensation related to his purchase of a company vehicle, and Mr. Cook’s 2014St. Romain’s 2018 total includes $20,161$6,819 in other compensation related to the sale of his company vehicle. |
| |
(2) | Includes medical, dental, and disability insurance premiums and the related tax gross-up amounts. |
PAY RATIO DISCLOSURE
As required by the Dodd-Frank Wall Street Reform and Consumer Protection Act, the SEC recently adopted a rule requiring public companies to disclose the ratio of the compensation of its CEO to the median compensation of its employees.
The following is a reasonable estimate, prepared under applicable SEC rules, of the ratio of the annual total compensation of our CEO to the median of the annual total compensation of our other employees. As allowed by the SEC’s final rule, we used the same median employee in our 2018 pay ratio calculation as identified in our year one calculation. In 2017, we identified our median employee by examining the 2017 total cash compensation for all employees, excluding the CEO, who were employed by us on December 31, 2017. As permitted, we excluded certain non-U.S. employees representing less than 5% of our total employee population of approximately 4,200. Specifically, we excluded from our employee population all individuals employed in Australia (75), the United Kingdom (25), Mexico (30), and Colombia (2), totaling 132 employees, or just over 3% of our employee population. As both our total employee population and excluded employee population as of December 31, 2018 is consistent with last year’s, and our compensation arrangements remain similar, we believe it is appropriate to use the same median employee for our 2018 disclosure. We do not believe any changes made in 2018 would significantly affect our pay ratio disclosure.
We calculated the annual total compensation for our median employee using the same methodology we use for our NEOs as set forth in the 2018 Summary Compensation Table above. See the table below for the results of our analysis.
|
| | | |
| Median employee annual total compensation | $ | 43,800 |
|
| Mr. Perez de la Mesa annual total compensation | $ | 3,282,465 |
|
| Ratio of CEO to median employee compensation | 75:1 |
|
The Grants of Plan-Based Awards Table below sets forth information about the cash plan awards and equity plan awards to our NEOs in 2016.2018.
FISCAL 20162018 GRANTS OF PLAN-BASED AWARDS
| | | Name | Grant Date | Estimated Future Payouts Under Non-Equity Incentive Plan Awards | Estimated Future Payouts Under Equity Incentive Plan Awards
Target (#) | All Other Option Awards: Number of Securities Underlying Options (#) | Exercise or Base Price of Option Awards ($/Sh) | Grant Date Fair Value of Stock and Option Awards ($) | Grant Date | Estimated Future Payouts Under Non-Equity Incentive Plan Awards | Estimated Future Payouts Under Equity Incentive Plan Awards Target (#) | All Other Option Awards: Number of Securities Underlying Options (#) | Exercise or Base Price of Option Awards ($/Sh) | Grant Date Fair Value of Stock and Option Awards ($) |
Target ($) | Maximum ($) | Threshold
($) | Target ($) | Maximum ($) |
| Manuel J. Perez de la Mesa | 02/25/2016 | (1) | N/A |
| | N/A |
| | N/A | | 30,000 | (4) | 80.78 | 859,650 |
| 02/28/2018 | (1) | N/A |
| N/A |
| N/A |
| N/A | | 18,000 | (4) | 138.03 | 809,460 |
|
| | 05/04/2016 | (1) | N/A |
| | N/A |
| | 12,000 | (5) | N/A | | N/A | 1,050,360 |
| 02/28/2018 | (1) | N/A |
| N/A |
| N/A |
| 7,200 | (5) | N/A | | N/A | 993,816 |
|
| | 02/25/2016 | (2) | 480,000 |
| | 960,000 |
| | N/A | | N/A | | N/A | N/A |
| 02/28/2018 | (2) | N/A |
| 500,000 |
| 1,000,000 |
| N/A | | N/A | | N/A | N/A |
|
| | 02/25/2016 | (3) | 480,000 |
| | 960,000 |
| | N/A | | N/A | | N/A | N/A |
| 02/28/2018 | (3) | 250,000 |
| 500,000 |
| 1,000,000 |
| N/A | | N/A | | N/A | N/A |
|
| Mark W. Joslin | 02/25/2016 | (1) | N/A |
| | N/A |
| | 9,000 | (5) | N/A | | N/A | 727,020 |
| 02/28/2018 | (1) | N/A |
| N/A |
| N/A |
| 6,000 | (5) | N/A | | N/A | 828,180 |
|
| | 02/25/2016 | (2) | 209,250 |
| | 418,500 |
| | N/A | | N/A | | N/A | N/A |
| 02/28/2018 | (2) | N/A |
| 221,250 |
| 442,500 |
| N/A | | N/A | | N/A | N/A |
|
| | 02/25/2016 | (3) | 279,000 |
| | 558,000 |
| | N/A | | N/A | | N/A | N/A |
| 02/28/2018 | (3) | 147,500 |
| 295,000 |
| 590,000 |
| N/A | | N/A | | N/A | N/A |
|
| Peter D. Arvan | | 02/28/2018 | (1) | N/A |
| N/A |
| N/A |
| 11,000 | (5) | N/A | | N/A | 1,518,330 |
|
| | | 02/28/2018 | (2) | N/A |
| 440,000 |
| 880,000 |
| N/A | | N/A | | N/A | N/A |
|
| | | 02/28/2018 | (3) | 220,000 |
| 440,000 |
| 880,000 |
| N/A | | N/A | | N/A | N/A |
|
| A. David Cook | 02/25/2016 | (1) | N/A |
| | N/A |
| | 9,000 | (5) | N/A | | N/A | 727,020 |
| 02/28/2018 | (1) | N/A |
| N/A |
| N/A |
| 6,000 | (5) | N/A | | N/A | 828,180 |
|
| | 02/25/2016 | (2) | 225,750 |
| | 451,500 |
| | N/A | | N/A | | N/A | N/A |
| 02/28/2018 | (2) | N/A |
| 317,000 |
| 634,000 |
| N/A | | N/A | | N/A | N/A |
|
| | 02/25/2016 | (3) | 301,000 |
| | 602,000 |
| | N/A | | N/A | | N/A | N/A |
| 02/28/2018 | (3) | 158,500 |
| 317,000 |
| 634,000 |
| N/A | | N/A | | N/A | N/A |
|
| Kenneth G. St. Romain | 02/25/2016 | (1) | N/A |
| | N/A |
| | 9,000 | (5) | N/A | | N/A | 727,020 |
| 02/28/2018 | (1) | N/A |
| N/A |
| N/A |
| 6,000 | (5) | N/A | | N/A | 828,180 |
|
| | 02/25/2016 | (2) | 217,500 |
| | 435,000 |
| | N/A | | N/A | | N/A | N/A |
| 02/28/2018 | (2) | N/A |
| 232,500 |
| 465,000 |
| N/A | | N/A | | N/A | N/A |
|
| | 02/25/2016 | (3) | 290,000 |
| | 580,000 |
| | N/A | | N/A | | N/A | N/A |
| 02/28/2018 | (3) | 155,000 |
| 310,000 |
| 620,000 |
| N/A | | N/A | | N/A | N/A |
|
| Jennifer M. Neil | 02/25/2016 | (1) | N/A |
| | N/A |
| | 3,600 | (5) | N/A | | N/A | 290,808 |
| |
| | 02/25/2016 | (2) | 142,500 |
| | 190,000 |
| | N/A | | N/A | | N/A | N/A |
| |
| | 02/25/2016 | (3) | 190,000 |
| | 380,000 |
| | N/A | | N/A | | N/A | N/A |
| |
| |
(1) | Granted under our 2007 LTIP. |
| |
(2) | Reflects grants under our Annual Cash PerformanceBonus Program. See Compensation Discussion and Analysis, “Annual Incentive Plan.” The target and maximum amounts included in this table reflect the potential payments based on 20162018 performance; the actual annual performance award payment amounts for 20162018 are disclosed in the “Non‑Equity Incentive Plan Compensation” column in the Summary Compensation Table. The target payouts included in this table reflect 100% of the 20162018 base salary amount for Mr.Messrs. Perez de la Mesa, Arvan and Cook and 75% of the 20162018 base salary amounts for each of the other NEOs.Messrs. Joslin and St. Romain. The maximum potential payouts are 200% for Mr.Messrs. Perez de la Mesa, Arvan and Cook and 150% for Messrs. Joslin Cook and St. Romain, and 100% for Ms. Neil.Romain. |
| |
(3) | Reflects grants under our SPIP for the three-year performance period that commenced January 1, 20162018 and will end December 31, 2018.2020. Target SPIP payout amounts are based on 100% of 20162018 base salaries for each NEO. The threshold SPIP payments reflect 50% of the 2018 base salaries and the maximum potential SPIP payouts reflect 200% of 20162018 base salaries. |
| |
(4) | This stock option grant cliff vests 50% after three years and 50% after five years, but would fully vest if there is a change of control and Mr. Perez de la Mesa experiences a qualifying termination within two years following the change of control.years. |
| |
(5) | Each of these restricted stock grants cliff vests 50% after three years and 50% after five years, and is alsoexcept for Mr. Arvan’s grant, which vests 100% after five years, in all cases subject to performance-based vestingthe achievement of applicable performance criteria. See Compensation Discussion and Analysis “Long-Term Equity Award” for a discussion of the applicable performance criteria. |
OUTSTANDING EQUITY AWARDS AT FISCAL YEAR-END
| | | | | Option Awards | Stock Awards | | Option Awards | Stock Awards |
| Name | Grant Date | Number of Securities Underlying Unexercised Options (#) Exercisable | Number of Securities Underlying Unexercised Options (#) Unexercisable | Option Exercise Price ($/Sh) | Option Expiration Date | Number of Shares or Units of Stock that Have Not Vested (#) | Market Value of Shares or Units that Have Not Vested ($) | Equity Incentive Plan Awards: Number of Unearned Shares, Units or Other Rights That Have Not Vested (#) | Equity Incentive Plan Awards: Number of Unearned Shares, Units or Other Rights That Have Not Vested ($) | Grant Date | Number of Securities Underlying Unexercised Options (#) Exercisable | Number of Securities Underlying Unexercised Options (#) Unexercisable | Option Exercise Price ($/Sh) | Option Expiration Date | Number of Shares or Units of Stock that Have Not Vested (#) | Market Value of Shares or Units that Have Not Vested ($) | Equity Incentive Plan Awards: Number of Unearned Shares, Units or Other Rights That Have Not Vested (#) | Equity Incentive Plan Awards: Number of Unearned Shares, Units or Other Rights That Have Not Vested ($) |
| Mr. Perez de la Mesa | 05/08/07 | 30,000 | - | | 37.85 | | 05/08/17 | N/A | | N/A | | N/A |
| N/A |
| 05/05/09 | 89,252 | - | | 18.44 | | 05/05/19 | N/A | | N/A | | N/A | | N/A | |
| | 02/26/08 | 120,000 | - | | 20.34 | | 02/26/18 | N/A | | N/A | | N/A |
| N/A |
| 02/23/10 | 160,000 | - | | 20.32 | | 02/23/20 | N/A | | N/A | | N/A | | N/A | |
| | 05/05/09 | 160,000 | - | | 18.44 | | 05/05/19 | N/A | | N/A | | N/A |
| N/A |
| 03/02/11 | 160,000 | - | | 24.50 | | 03/02/21 | N/A | | N/A | | N/A | | N/A | |
| | 02/23/10 | 160,000 | - | | 20.32 | | 02/23/20 | N/A | | N/A | | N/A |
| N/A |
| 02/28/12 | 105,000 | - | | 37.13 | | 02/28/22 | N/A | | N/A | | N/A | | N/A | |
| | 03/02/11 | 160,000 | - |
| 24.50 | | 03/02/21 | N/A | | N/A | | N/A |
| N/A |
| 02/27/13 | 90,000 | - | | 45.61 | | 02/27/23 | N/A | | N/A | | N/A | | N/A | |
| | 02/28/12 | 52,500 | 52,500 | (1) | 37.13 | | 02/28/22 | N/A | | N/A | | N/A |
| N/A |
| 02/27/14 | 18,750 | 18,750 | (1) | 58.26 | | 02/27/24 | 7,500 | (6) | 1,114,875 | (13) | N/A | | N/A | |
| | 02/27/13 | 45,000 | 45,000 | (2) | 45.61 | | 02/27/23 | N/A | | N/A | | N/A |
| N/A |
| 02/26/15 | 18,750 | 18,750 | (2) | 69.85 | | 02/26/25 | 7,500 | (7) | 1,114,875 | (13) | N/A | | N/A | |
| | 02/27/14 | - | 37,500 | (3) | 58.26 | | 02/27/24 | 15,000 | (8) | 1,565,100 | (12) | N/A |
| N/A |
| 02/25/16 | - | 30,000 | (3) | 80.78 | | 02/25/26 | N/A | | N/A | | N/A | | N/A | |
| | 02/26/15 | - | 37,500 | (4) | 69.85 | | 02/26/25 | 15,000 | (9) | 1,565,100 | (12) | N/A |
| N/A |
| 05/04/16 | N/A | N/A | | N/A | | N/A | N/A | | N/A | | 12,000 | (9) | 1,783,800 | (13) |
| | 02/25/16 | - | 30,000 | (5) | 80.78 | | 02/25/26 | N/A | | N/A | | N/A |
| N/A |
| 03/01/17 | - | 22,500 | (4) | 117.04 | | 03/01/27 | N/A | | N/A | | 9,000 | (10) | 1,337,850 | (13) |
| | 05/04/16 | N/A | N/A | | N/A | | N/A | N/A | | N/A | | 12,000 | (10) | 1,252,080 | (12) | 02/28/18 | - | 18,000 | (5) | 138.03 | | 02/28/28 | N/A | | N/A | | 7,200 | (12) | 1,070,280 | (13) |
| Mr. Joslin | 05/08/07 | 7,500 | - | | 37.85 | | 05/08/17 | N/A | | N/A | | N/A |
| N/A |
| 05/05/09 | 13,000 | - | | 18.44 | | 05/05/19 | N/A | | N/A | | N/A | | N/A | |
| | 02/26/08 | 40,000 | - | | 20.34 | | 02/26/18 | N/A | | N/A | | N/A |
| N/A |
| 02/27/14 | N/A | N/A | | N/A | | N/A | 5,000 | (6) | 743,250 | (13) | N/A | | N/A | |
| | 05/05/09 | 39,000 | - | | 18.44 | | 05/05/19 | N/A | | N/A | | N/A |
| N/A |
| 02/26/15 | N/A | N/A | | N/A | | N/A | 5,000 | (7) | 743,250 | (13) | N/A | | N/A | |
| | 02/28/12 | N/A | N/A | | N/A | | N/A | 7,200 | (6) | 751,248 | (12) | N/A |
| N/A |
| 02/25/16 | N/A | N/A | | N/A | | N/A | | N/A | | 9,000 | (8) | 1,337,850 | (13) |
| | 02/27/13 | N/A | N/A | | N/A | | N/A | 6,000 | (7) | 626,040 | (12) | N/A |
| N/A |
| 03/01/17 | N/A | N/A | | N/A | | N/A | | N/A | | 7,500 | (10) | 1,114,875 | (13) |
| | 02/27/14 | N/A | N/A | | N/A | | N/A | 10,000 | (8) | 1,043,400 | (12) | N/A |
| N/A |
| 02/28/18 | N/A | N/A | | N/A | | N/A | | N/A | | 6,000 | (12) | 891,900 | (13) |
| | 02/26/15 | N/A | N/A | | N/A | | N/A | 10,000 | (9) | 1,043,400 | (12) | N/A |
| N/A |
| |
| Mr. Arvan | | 01/03/17 | N/A | N/A | | N/A | | N/A | N/A | | N/A | | 14,335 | (11) | 2,130,898 | (13) |
| | 02/25/16 | N/A | N/A | | N/A | | N/A | | N/A | | 9,000 | (11) | 939,060 | (12) | 02/28/18 | N/A | N/A | | N/A | | N/A | N/A | | N/A | | 11,000 | (12) | 1,635,150 | (13) |
| Mr. Cook | 02/26/08 | 48,000 | - | | 20.34 | | 02/26/18 | N/A | | N/A | | N/A |
| N/A |
| 05/05/09 | 20,000 | - | | 18.44 | | 05/05/19 | N/A | | N/A | | N/A | | N/A | |
| | 05/05/09 | 30,000 | - | | 18.44 | | 05/05/19 | N/A | | N/A | | N/A |
| N/A |
| 02/27/14 | N/A | N/A | | N/A | | N/A | 5,000 | (6) | 743,250 | (13) | N/A | | N/A | |
| | 02/28/12 | N/A | N/A | | N/A | | N/A | 7,200 | (6) | 751,248 | (12) | N/A |
| N/A |
| 02/26/15 | N/A | N/A | | N/A | | N/A | 5,000 | (7) | 743,250 | (13) | N/A | | N/A | |
| | 02/27/13 | N/A | N/A | | N/A | | N/A | 6,000 | (7) | 626,040 | (12) | N/A |
| N/A |
| 02/25/16 | N/A | N/A | | N/A | | N/A | N/A | | N/A | | 9,000 | (8) | 1,337,850 | (13) |
| | 02/27/14 | N/A | N/A | | N/A | | N/A | 10,000 | (8) | 1,043,400 | (12) | N/A |
| N/A |
| 03/01/17 | N/A | N/A | | N/A | | N/A | N/A | | N/A | | 7,500 | (10) | 1,114,875 | (13) |
| | 02/26/15 | N/A | N/A | | N/A | | N/A | 10,000 | (9) | 1,043,400 | (12) | N/A |
| N/A |
| 02/28/18 | N/A | N/A | | N/A | | N/A | N/A | | N/A | | 6,000 | (12) | 891,900 | (13) |
| | 02/25/16 | N/A | N/A | | N/A | | N/A | N/A | | N/A | | 9,000 | (11) | 939,060 | (12) | |
Note: Table continues on next page.
| | | | | Option Awards | Stock Awards | | Option Awards | Stock Awards |
| Name | Grant
Date | Number of Securities Underlying Unexercised Options (#) Exercisable | Number of
Securities
Underlying Unexercised
Options (#) Unexercisable | Option
Exercise
Price
($/Sh) | Option
Expiration
Date | Number of
Shares or Units
of Stock that Have Not Vested (#) | Market Value of Shares or Units
that Have Not Vested
($) | Equity Incentive Plan Awards: Number of Unearned Shares, Units or Other Rights That Have Not Vested (#) | Equity Incentive Plan Awards: Number of Unearned Shares, Units or Other Rights That Have Not Vested ($) | Grant
Date | Number of Securities Underlying Unexercised Options (#) Exercisable | Number of
Securities
Underlying Unexercised
Options (#) Unexercisable | Option
Exercise
Price
($/Sh) | Option
Expiration
Date | Number of
Shares or Units
of Stock that Have Not Vested (#) | Market Value of Shares or Units
that Have Not Vested
($) | Equity Incentive Plan Awards: Number of Unearned Shares, Units or Other Rights That Have Not Vested (#) | Equity Incentive Plan Awards: Number of Unearned Shares, Units or Other Rights That Have Not Vested ($) |
| Mr. St. Romain | 05/08/07 | 7,500 | - | | 37.85 | | 05/08/17 | N/A | | N/A |
| | N/A |
| N/A |
| 05/05/09 | 60,000 | - | | 18.44 | | 05/05/19 | N/A | | N/A | | N/A | | N/A | |
| | 02/26/08 | 40,000 | - | | 20.34 | | 02/26/18 | N/A | | N/A |
| | N/A |
| N/A |
| 02/23/10 | 60,000 | - | | 20.32 | | 02/23/20 | N/A | | N/A | | N/A | | N/A | |
| | 05/05/09 | 60,000 | - | | 18.44 | | 05/05/19 | N/A | | N/A |
| | N/A |
| N/A |
| 03/02/11 | 60,000 | - | | 24.50 | | 03/02/21 | N/A | | N/A | | N/A | | N/A | |
| | 02/23/10 | 60,000 | - | | 20.32 | | 02/23/20 | N/A | | N/A |
| | N/A |
| N/A |
| 02/28/12 | 27,000 | - | | 37.13 | | 02/28/22 | N/A | | N/A | | N/A | | N/A | |
| | 03/02/11 | 60,000 | - |
| 24.50 | | 03/02/21 | N/A | | N/A |
| | N/A |
| N/A |
| 02/27/13 | 15,000 | - | | 45.61 | | 02/27/23 | N/A | | N/A | | N/A | | N/A | |
| | 02/28/12 | 13,500 | 13,500 | (1) | 37.13 | | 02/28/22 | 1,800 | (6) | 187,812 |
| (12) | N/A |
| N/A |
| 02/27/14 | 3,125 | 3,125 | (1) | 58.26 | | 02/27/24 | 3,750 | (6) | 557,438 | (13) | N/A | | N/A | |
| | 02/27/13 | 7,500 | 7,500 | (2) | 45.61 | | 02/27/23 | 3,000 | (7) | 313,020 |
| (12) | N/A |
| N/A |
| 02/26/15 | 3,125 | 3,125 | (2) | 69.85 | | 02/26/25 | 3,750 | (7) | 557,438 | (13) | N/A | | N/A | |
| | 02/27/14 | - | 6,250 | (3) | 58.26 | | 02/27/24 | 7,500 | (8) | 782,550 |
| (12) | N/A |
| N/A |
| 02/25/16 | N/A | N/A | | N/A | | N/A | N/A | | N/A | | 9,000 | (8) | 1,337,850 | (13) |
| | 02/26/15 | - | 6,250 | (4) | 69.85 | | 02/26/25 | 7,500 | (9) | 782,550 |
| (12) | N/A |
| N/A |
| 03/01/17 | N/A | N/A | | N/A | | N/A | N/A | | N/A | | 7,500 | (10) | 1,114,875 | (13) |
| | 02/25/16 | N/A | N/A | | N/A | | N/A | N/A | | N/A |
| | 9,000 | (11) | 939,060 | (12) | 02/28/18 | N/A | N/A | | N/A | | N/A | N/A | | N/A | | 6,000 | (12) | 891,900 | (13) |
| Ms. Neil | 02/28/12 | - | 2,000 | (1) | 37.13 | | 02/28/22 | 800 | (6) | 83,472 |
| (12) | N/A |
| N/A |
| |
| | 02/27/13 | N/A | N/A | | N/A | | N/A | 1,600 | (7) | 166,944 |
| (12) | N/A |
| N/A |
| |
| | 02/27/14 | N/A | N/A | | N/A | | N/A | 3,200 | (8) | 333,888 |
| (12) | N/A |
| N/A |
| |
| | 02/26/15 | - | 4,500 | (4) | 69.85 | | 02/26/25 | 1,800 | (9) | 187,812 |
| (12) | N/A |
| N/A |
| |
| | 02/25/16 | N/A | N/A | | N/A | | N/A | N/A | | N/A |
| | 3,600 | (11) | 375,624 | (12) | |
| |
(1) | These options vested on February 28, 2017.27, 2019. |
| |
(2) | These options will vest on February 27, 2018.26, 2020. |
| |
(3) | These options vested 50% on February 27, 201725, 2019 and 50% will vest on February 27, 2019.25, 2021. |
| |
(4) | These options will vest 50% on February 26, 2018March 1, 2020 and 50% on February 26, 2020.March 1, 2022. |
| |
(5) | These options will vest 50% on February 25, 201928, 2021 and 50% on February 25, 2021.28, 2023. |
| |
(6) | These shares vested on February 28, 2017.27, 2019. |
| |
(7) | These shares will vest on February 27, 2018.26, 2020. |
| |
(8) | These shares vested 50% on February 27, 2017March 15, 2019 and 50% will vest on February 27, 2019.25, 2021 if the performance-based vesting criteria is met. |
| |
(9) | These shares will vest 50% on February 26, 2018 and 50% on February 26, 2020. |
| |
(10)
| These shares will vest 50% on May 4, 2019 and 50% on May 4, 2021 if the performance-based vesting criteria is met. |
| |
(11)(10)
| These shares will vest 50% on February 25, 2019March 15, 2020 and 50% on February 25, 2021March 1, 2022 if the performance-based vesting criteria is met. |
| |
(11) | These shares will vest on January 3, 2022 if the performance-based vesting criteria is met. |
| |
(12) | These shares will vest 50% on March 15, 2021 and 50% on February 28, 2023 if the performance-based vesting criteria is met. |
| |
(13) | Based on the market value of $104.34$148.65 per share of our Common Stock on December 30, 2016.31, 2018. |
The table below summarizes the number of shares acquired and the dollar amounts realized by NEOs from the exercise of stock options and the vesting of restricted stock in 2016.2018.
OPTION EXERCISES AND STOCK VESTED
| | | | | Option Awards | | Stock Awards | | Option Awards | | Stock Awards |
| Name | | Number of
Shares Acquired
Upon Exercise (#) | | Value Realized
Upon Exercise ($) | | Number of
Shares Acquired
Upon Vesting (#) | | Value Realized
Upon Vesting ($) | | Number of
Shares Acquired
Upon Exercise (#) | | Value Realized
Upon Exercise ($) | | Number of
Shares Acquired
Upon Vesting (#) | | Value Realized
Upon Vesting ($) |
| Manuel J. Perez de la Mesa | | 30,000 |
| | $ | 1,885,518 |
| | — |
| | $ | — |
| | 100,748 |
| | $ | 13,824,468 |
| | 7,500 |
| | $ | 1,068,975 |
|
| Mark W. Joslin | | 7,500 |
| | 472,500 |
| | 16,400 |
| | 1,335,772 |
| | 66,000 |
| | 8,434,507 |
| | 11,000 |
| | 1,556,010 |
|
| Peter D. Arvan | | | — |
| | — |
| | — |
| | — |
|
| A. David Cook | | 18,000 |
| | 1,157,924 |
| | 18,000 |
| | 1,465,740 |
| | 58,000 |
| | 7,584,350 |
| | 11,000 |
| | 1,556,010 |
|
| Kenneth G. St. Romain | | 9,000 |
| | 333,090 |
| | 3,000 |
| | 245,490 |
| | 40,000 |
| | 5,024,630 |
| | 6,750 |
| | 956,168 |
|
| Jennifer M. Neil | | 2,000 |
| | 104,105 |
| | 4,600 |
| | 374,618 |
| |
NONQUALIFIED DEFERRED COMPENSATION
Under our Deferred Compensation Plan, certain executives, including our NEOs, may elect to defer all or a portion of their base salary and annual non-equity incentive compensation. Participants choose to invest their deferrals in one or more specified investment funds. Participants may change their fund selection at any time, subject to certain limitations. The table below shows the funds available and their annual rates of return for the calendar year ended December 31, 20162018 as reported by T. Rowe Price. Earnings are determined by the results of the individual investments.
| | | Name of Fund | | Rate of Return | | Name of Fund | | Rate of Return | | Rate of Return | | Name of Fund | | Rate of Return |
| Artisan International Fund | | (9.66 | )% | | TRP Retirement 2005 Fund | | 6.72 | % | | (10.86 | )% | | TRP Retirement 2015 Fund | | (4.17 | )% |
| Goldman Sachs Small Cap Value Fund | | 24.65 | % | | TRP Retirement 2010 Fund | | 7.11 | % | | (14.02 | )% | | TRP Retirement 2020 Fund | | (4.94 | )% |
| MSIF U.S. Real Estate Fund | | 6.17 | % | | TRP Retirement 2015 Fund | | 7.31 | % | |
| TRP Equity Income Fund | | 19.28 | % | | TRP Retirement 2020 Fund | | 7.41 | % | |
| Delaware Value Fund | | | (2.91 | )% | | TRP Retirement 2025 Fund | | (5.62 | )% |
| TRP Growth Stock Fund | | 1.41 | % | | TRP Retirement 2025 Fund | | 7.55 | % | | (1.03 | )% | | TRP Retirement 2030 Fund | | (6.28 | )% |
| TRP Mid-Cap Growth Fund | | 6.30 | % | | TRP Retirement 2030 Fund | | 7.69 | % | | (2.04 | )% | | TRP Retirement 2035 Fund | | (6.87 | )% |
| TRP Government Money Fund | | 0.02 | % | | TRP Retirement 2035 Fund | | 7.64 | % | | 1.48 | % | | TRP Retirement 2040 Fund | | (7.32 | )% |
| Vanguard 500 Index Fund | | 11.93 | % | | TRP Retirement 2040 Fund | | 7.63 | % | | (4.43 | )% | | TRP Retirement 2045 Fund | | (7.57 | )% |
| TRP Small Cap Stock Fund | | 18.57 | % | | TRP Retirement 2045 Fund | | 7.69 | % | | (3.24 | )% | | TRP Retirement 2050 Fund | | (7.58 | )% |
| JP Morgan Mid-Cap Value | | 14.62 | % | | TRP Value Fund | | 10.96 | % | | (11.65 | )% | | TRP Retirement 2055 Fund | | (7.62 | )% |
| Dodge & Cox Income Fund | | 5.61 | % | | | | | (0.31 | )% | | TRP Retirement 2060 Fund | | (7.57 | )% |
| TRP Retirement 2005 Fund | | | (3.26 | )% | | TRP Value Fund | | (9.44 | )% |
| TRP Retirement 2010 Fund | | | (3.61 | )% | | |
Benefits under our Deferred Compensation Plan will be paid to our NEOs as each executive elects, but no earlier than one full year after the end of the plan year for which compensation is deferred or six months after termination of employment. However, upon a showing of financial hardship and certain other requirements, an NEO may be allowed to access funds in his deferred compensation account earlier than the beginning of the year following the executive’s retirement or termination. In the event of a change of control, all vested accrued benefits will automatically be accelerated and payable in full. The time and schedule of payments may also be accelerated if the participant becomes disabled, to fulfill a qualified domestic relations order, if the amount is less than $10,000 or to pay employment taxes. Benefits can be received either as a lump sum payment or installments.
The following table summarizes the nonqualified deferred compensation earned by our NEOs in 2016.2018. All amounts relate to our Deferred Compensation Plan.
| | | Name | | Executive Contributions in Last FY | | Company Contributions in Last FY (1) | | Aggregate Gains in Last FY | | Aggregate Withdrawals/ Distributions | | Aggregate Balance at Last FYE | | | Executive Contributions in Last FY | | Company Contributions in Last FY (1) | | Aggregate Losses in Last FY | | Aggregate Withdrawals/ Distributions | | Aggregate Balance at Last FYE | |
| Manuel J. Perez de la Mesa | | $ | 81,891 |
| | $ | 54,913 |
| | $ | 136,013 |
| | $ | — |
| | $ | 1,477,244 |
| (2) | | $ | 87,221 |
| | $ | 58,776 |
| | $ | (101,509 | ) | | $ | — |
| | $ | 2,063,534 |
| (2) |
| Mark W. Joslin | | 324,172 |
| | 27,046 |
| | 225,885 |
| | — |
| | 1,932,151 |
| (3) | | 48,182 |
| | 24,287 |
| | (145,162 | ) | | — |
| | 2,778,242 |
| (3) |
| Peter D. Arvan | | | 89,553 |
| | 15,108 |
| | (6,086 | ) | | — |
| | 127,418 |
| (4) |
| A. David Cook | | 44,285 |
| | 9,994 |
| | 12,042 |
| | (85,701 | ) | | 175,456 |
| (4) | | 198,750 |
| | 30,982 |
| | (36,552 | ) | | (67,299 | ) | | 583,886 |
| (5) |
| Kenneth G. St. Romain | | 71,589 |
| | 25,195 |
| | 50,992 |
| | — |
| | 565,018 |
| (5) | | 79,409 |
| | 28,704 |
| | (58,716 | ) | | — |
| | 866,425 |
| (6) |
| Jennifer M. Neil | | 34,858 |
| | 12,976 |
| | 15,118 |
| | — |
| | 215,143 |
| (6) | |
| |
(1) | These amounts are included in the Summary Compensation Table within All Other Compensation. |
| |
(2) | Includes Company contributions of $59,885 for 2015$76,727 in 2017 and $64,888 for 2014$54,913 in 2016 disclosed in the Summary Compensation Table (All Other Compensation). |
| |
(3) | Includes Company contributions of $28,285 for 2015$46,010 in 2017 and $27,856 for 2014$27,046 in 2016 disclosed in the Summary Compensation Table (All Other Compensation). |
| |
(4) | Includes Company contributions of $32,411 for 2015 and $31,667 for 2014$8,769 in 2017 disclosed in the Summary Compensation Table (All Other Compensation). |
| |
(5) | Includes Company contributions of $27,136 for 2015$37,574 in 2017 and $26,279 for 2014$9,994 in 2016 disclosed in the Summary Compensation Table (All Other Compensation). |
| |
(6) | Includes Company contributions of $15,657 for 2015$37,573 in 2017 and $25,195 in 2016 disclosed in the Summary Compensation Table (All Other Compensation). |
POTENTIAL PAYMENTS UPON TERMINATION OF EMPLOYMENT OR CHANGE OF CONTROL
Effect of Termination of Employment or Change of Control upon Outstanding Equity Awards
Beginning with grants in 2015, our equity awards are subject to “double trigger” accelerated vesting upon a change of control, which is explained in more detail below.
Stock options granted to NEOs (priorprior to 2015),2015, subject to certain limitations, will:
| |
| ▪ | immediately vest and become fully exercisable upon a change of control, death or disability; |
| |
| ▪ | remain exercisable and continue to vest in accordance with the original vesting schedule upon retirement (which is defined as attainment of the age of 55 years or more and continuous service to us for a period of at least ten years), provided the recipient complies with certain restrictive covenants; |
| |
| ▪ | are immediatelybe forfeited, whether or not then exercisable, upon termination for cause; and |
| |
| ▪ | remain exercisable for the shorter of 90 days or the remaining term upon a termination without cause, unless the Compensation Committee, in its discretion, allows the options to continue to vest in accordance with their original schedule and maintain their original termination date. |
For grants in 2015 and beyond, the provisions above are generally applicable, except that in connection with a change of control, the stock options will only vest and become fully exercisable if the executive experiences a qualifying termination within two years after the change of control. A qualifying termination includes a termination by the Company without cause or a termination by the executive for good reason (which is defined as a diminution of the executive’s compensation or responsibilities, or a relocation of more than 50 miles).
Shares of restricted stock granted to NEOs (priorprior to 2015),2015, subject to certain limitations, will:
| |
| ▪ | fully vest upon a change of control, death or disability; |
| |
| ▪ | continue to vest in accordance with the original vesting schedule upon retirement, provided the recipient complies with certain restrictive covenants; and |
| |
| ▪ | are immediatelybe forfeited upon any other termination of employment, whether voluntary or involuntary, unless the Compensation Committee, in its discretion, provides otherwise. |
For restricted stock grants in 2015 and beyond, the provisions above are generally applicable, except that in connection with a change of control, any applicable performance condition will be waived and the shares of restricted stock will only fully vest if the executive experiences a qualifying termination (as described above) within two years after the change of control.
Under the agreements, “cause” is generally defined as the recipient’s (i) conviction of a felony or any crime or offense lesser than a felony involving the property of the Company; (ii) conduct that has caused demonstrable and serious injury to the Company, monetary or otherwise; (iii) willful refusal to perform or substantial disregard of duties properly assigned; or (iv) breach of duty of loyalty to the Company or other act of fraud or dishonesty with respect to the Company.
Assuming a change of control or the executive’s termination of employment due to death or disability occurred on December 31, 2016,2018, the following table sets forth the value of all unvested stock options and shares of restricted stock granted prior to 2015 and held by the NEOs at December 31, 20162018 that would immediately vest upon such event.
| | | | | Number of Shares Underlying Unvested Awards | | Unrealized Value of Unvested Awards | | Number of Shares Underlying Unvested Awards | | Unrealized Value of Unvested Awards |
| Name | | Option Awards | | Stock Awards | | Option Awards (1) | | Stock Awards (2) | | Total Awards | | Option Awards | | Stock Awards | | Option Awards (1) | | Stock Awards (2) | | Total Awards |
| Manuel J. Perez de la Mesa | | 135,000 |
| | 15,000 |
| | $ | 7,899,375 |
| | $ | 1,565,100 |
| | $ | 9,464,475 |
| | 18,750 |
| | 7,500 |
| | $ | 1,694,813 |
| | $ | 1,114,875 |
| | $ | 2,809,688 |
|
| Mark W. Joslin | | — |
| | 23,200 |
| | — |
| | 2,420,688 |
| | 2,420,688 |
| | — |
| | 5,000 |
| | — |
| | 743,250 |
| | 743,250 |
|
| Peter D. Arvan | | | — |
| | — |
| | — |
| | — |
| | — |
|
| A. David Cook | | — |
| | 23,200 |
| | — |
| | 2,420,688 |
| | 2,420,688 |
| | — |
| | 5,000 |
| | — |
| | 743,250 |
| | 743,250 |
|
| Kenneth G. St. Romain | | 27,250 |
| | 12,300 |
| | 1,635,810 |
| | 1,283,382 |
| | 2,919,192 |
| | 3,125 |
| | 3,750 |
| | 282,469 |
| | 557,438 |
| | 839,907 |
|
| Jennifer M. Neil | | 2,000 |
| | 5,600 |
| | 134,420 |
| | 584,304 |
| | 718,724 |
| |
Assuming the executive’s termination of employment due to death or disability or a change of control and a qualifying termination occurred on December 31, 2016,2018, the following table sets forth the value of all unvested stock options and shares of restricted stock granted in each of the years from 2015 and 2016through 2018 and held by the NEOs at December 31, 20162018 that would immediately vest upon such event (amounts do not include shares referenced in the table above).
| | | | | Number of Shares Underlying Unvested Awards | | Unrealized Value of Unvested Awards | | Number of Shares Underlying Unvested Awards | | Unrealized Value of Unvested Awards |
| Name | | Option Awards | | Stock Awards | | Option Awards (1) | | Stock Awards (2) | | Total Awards | | Option Awards | | Stock Awards | | Option Awards (1) | | Stock Awards (2) | | Total Awards |
| Manuel J. Perez de la Mesa | | 67,500 |
| | 27,000 |
| | $ | 2,000,175 |
| | $ | 2,817,180 |
| | $ | 4,817,355 |
| | 89,250 |
| | 35,700 |
| | $ | 4,415,985 |
| | $ | 5,306,805 |
| | $ | 9,722,790 |
|
| Mark W. Joslin | | — |
| | 19,000 |
| | — |
| | 1,982,460 |
| | 1,982,460 |
| | — |
| | 27,500 |
| | — |
| | 4,087,875 |
| | 4,087,875 |
|
| Peter D. Arvan | | | — |
| | 25,335 |
| | — |
| | 3,766,048 |
| | 3,766,048 |
|
| A. David Cook | | — |
| | 19,000 |
| | — |
| | 1,982,460 |
| | 1,982,460 |
| | — |
| | 27,500 |
| | — |
| | 4,087,875 |
| | 4,087,875 |
|
| Kenneth G. St. Romain | | 6,250 |
| | 16,500 |
| | 215,563 |
| | 1,721,610 |
| | 1,937,173 |
| | 3,125 |
| | 26,250 |
| | 246,250 |
| | 3,902,063 |
| | 4,148,313 |
|
| Jennifer M. Neil | | 4,500 |
| | 5,400 |
| | 155,205 |
| | 563,436 |
| | 718,641 |
| |
| |
(1) | We calculated by multiplying the number of unvested in-the-money stock options by the closing price of our Common Stock as of December 30, 201631, 2018 and then deducting the aggregate exercise price for these options. |
| |
(2) | We calculated by multiplying the number of shares of unvested restricted stock by the closing price of our Common Stock as of December 30, 2016.31, 2018. |
Severance Payments upon Termination without Cause
Upon termination other than for cause, Mr. Perez de la MesaArvan is entitled to receive his base salary for a period of six months after termination, and the other executive officersNEOs are entitled to receive their respective base salaries for a period of three months. Prior to his retirement effective December 31, 2018, Mr. Perez de la Mesa was also entitled to receive his base salary for a period of six months following a termination other than for cause.
The table below presents the amounts wethat would paybe payable to each NEO upon termination without cause as of December 31, 2016.2018.
| | | Name | | Maximum Cash Payout upon Termination Without Cause | | Maximum Cash Payout upon Termination Without Cause |
| Manuel J. Perez de la Mesa | | $ | 240,000 |
| | $ | 250,000 |
|
| Mark W. Joslin | | 69,750 |
| | 73,750 |
|
| Peter D. Arvan | | | 220,000 |
|
| A. David Cook | | 75,250 |
| | 79,250 |
|
| Kenneth G. St. Romain | | 72,500 |
| | 77,500 |
|
| Jennifer M. Neil | | 47,500 |
| |
Executive officersThe NEOs are not entitled to any additional compensation, perquisites or other personal benefits upon a change of control, retirement or termination, except for future payments under our 401(k) Plan and Deferred Compensation Plan.
DIRECTOR COMPENSATION
The many responsibilities and risks of serving as a director of a public company require that we provide adequate compensation in order to attract and retain qualified and productive directors. Our directors play an important role in guiding our strategic direction and overseeing our management.
In 2015, the Board conducted a review of non-employee director and chairman compensation. The Compensation Committee retained theregularly reviews non-employee director compensation, periodically retaining an independent compensation consulting firm of Lyons, Benenson & Company Inc. (Lyons) to assist with its review. Lyons reported directlyIn 2018, no changes were made to the Compensation Committee chairman and was advised by the Compensation Committee to compare our non-employee director compensation program against our peer group. Upon conclusion of its review and analysis, the Board adopted the following cash compensation structure, except that effective immediately followingMay 2018, the Board increased Chairman Stokely’s annual stockholdercash retainer from $90,000 to $100,000. Our other non-employee directors receive an annual cash retainer of $55,000. Directors also receive annual fees for serving on the Board’s committees, as noted in the table below.
|
| | | | | | | | |
| Committee | | Chairman Fee | | Member Fee |
| Audit | | $ | 20,000 |
| | $ | 10,000 |
|
| Compensation | | 15,000 |
| | 10,500 |
|
| Nominating and Corporate Governance | | 15,000 |
| | 7,500 |
|
| Strategic Planning | | 15,000 |
| | 7,500 |
|
Our directors do not receive separate per meeting in May 2015:
| |
▪ | Lead independent director annual retainer - $90,000 |
| |
▪ | Non-employee director annual retainer - $55,000 |
| |
▪ | Audit Committee chairman - $20,000 |
| |
▪ | Audit Committee membership - $10,000 |
| |
▪ | Compensation Committee chairman - $15,000 |
| |
▪ | Compensation Committee membership - $10,500 |
| |
▪ | Nominating and Corporate Governance Committee chairman - $15,000 |
| |
▪ | Nominating and Corporate Governance Committee membership - $7,500 |
| |
▪ | Strategic Planning Committee chairman - $15,000 |
| |
▪ | Strategic Planning Committee membership - $7,500 |
Wefees for attending Board or committee meetings, but we do reimburse our directorsthem for reasonable out-of-pocket expenses they incur to attend Board and committee meetings and director education programs.
Directors receive annual equity awards and may also elect to receive equity grants in lieu of their cash compensation. In 2016,2018, each non-employee director was permitted to elect to receive his annual equity compensation in (i) 3,4282,165 stock options with an exercise price equal to our Common Stock’s closing price on the grant date; or (ii) 1,371866 shares of restricted stock. The annual equity awards are granted on the date of the annual meeting of stockholders and except under certain limited circumstances, the options and restricted stock vest no earlier than one year after the grant date, and any options granted are exercisable for up to ten years after the grant date. EachExcluding Ms. Oler, who joined the Board in October and thus did not receive an equity grant in 2018, each of our non-employeenon‑employee directors elected to receive their 20162018 equity compensation in the form of restricted stock. Total non-employeenon‑employee Board annual compensation for 20162018 was $1,274,245.$1,239,590.
The table below summarizes the compensation we paid to our non-employee directors and our chairman during the year ended December 31, 2016.2018.
| | | Name | | Fees Earned or Paid
in Cash | | Stock
Awards (1) | | All Other
Compensation | | Total | | Fees Earned or Paid
in Cash | | Stock
Awards (1) | | Total |
| Andrew W. Code | | $ | 65,472 |
| (2) | $ | 120,004 |
| | $ | — |
| | $ | 185,476 |
| | $ | 65,433 |
| (2) | $ | 120,054 |
| | $ | 185,487 |
|
James J. Gaffney (3) | | 33,333 |
| | — |
| | — |
| | 33,333 |
| |
| Timothy M. Graven | | 73,125 |
| | 120,004 |
| | — |
| | 193,129 |
| | 82,500 |
| | 120,054 |
| | 202,554 |
|
George T. Haymaker, Jr. (3) | | 32,291 |
| | — |
| | — |
| | 32,291 |
| |
| Debra S. Oler | | | 9,166 |
| | — |
| | 9,166 |
|
| Harlan F. Seymour | | 90,125 |
| | 120,004 |
| | — |
| | 210,129 |
| | 92,500 |
| | 120,054 |
| | 212,554 |
|
| Robert C. Sledd | | 75,500 |
| | 120,004 |
| | — |
| | 195,504 |
| | 75,500 |
| | 120,054 |
| | 195,554 |
|
| John E. Stokely | | 116,250 |
| | 120,004 |
| | — |
| | 236,254 |
| | 121,667 |
| | 120,054 |
| | 241,721 |
|
| David G. Whalen | | 68,125 |
| | 120,004 |
| | — |
| | 188,129 |
| | 72,500 |
| | 120,054 |
| | 192,554 |
|
Wilson B. Sexton (4) | | 90,000 |
| | 169,371 |
| | 6,355 |
| | 265,726 |
| |
| |
(1) | Amounts shown do not reflect compensation actually received by the directors. Instead, these amounts reflect the total estimated grant date fair value of the stock awards, which is based on the closing price of our Common Stock on the date of grant in accordance with FASB ASC Topic 718. |
| |
(2) | The amount reported in this column represents the grant date fair valuesvalue of the stock awards Mr. Code opted to receive in lieu of cash compensation. |
| |
| Messrs. Gaffney and Haymaker retired effective May 2016, immediately following the annual meeting. |
| |
(4)
| Our chairman, Mr. Sexton, is eligible to participate in our 401(k) Plan, Deferred Compensation Plan and medical, dental and long-term disability programs on the same basis as our officers. |
As of December 31, 2016,2018, options outstanding, options exercisable and stock awards outstanding for each non-employee director included the following:
| | | Director | | Options
Outstanding
and Exercisable | | Stock Awards
Outstanding | | Options
Outstanding
and Exercisable | | Stock Awards
Outstanding |
| Mr. Code | | — |
| | 2,119 |
| | — |
| | 1,338 |
|
| Mr. Graven | | — |
| | 1,371 |
| | — |
| | 866 |
|
| Ms. Oler | | | — |
| | — |
|
| Mr. Seymour | | — |
| | 1,371 |
| | — |
| | 866 |
|
| Mr. Sledd | | 21,662 |
| | 1,371 |
| | 8,696 |
| | 866 |
|
| Mr. Stokely | | — |
| | 1,371 |
| | — |
| | 866 |
|
| Mr. Whalen | | — |
| | 1,371 |
| | — |
| | 866 |
|
| Mr. Sexton | | 19,929 |
| | 1,935 |
| |
CERTAIN RELATIONSHIPS AND RELATED TRANSACTIONS
Our policy for transactions with related persons is included within our Audit Committee Charter. Our Audit Committee Charter requires that the Audit Committee review and approve all related person transactions of the type that would be required to be disclosed in this proxy statement and as may otherwise be required by NASDAQ.Nasdaq.
The Audit Committee was not requested to, and did not approve, any transactions required to be reported under SEC rules in fiscal year 2016.2018.
Section 16(a) Beneficial Ownership Reporting Compliance
Section 16(a) of the Exchange Act requires our directors and executive officers and persons owning more than 10% of a registered class of our equity securities to file with the SEC reports of ownership and changes in ownership of our Common Stock. Directors, executive officers and greater than 10% stockholders are required by SEC regulations to furnish us with copies of all Section 16(a) forms they file. Based solely on a review of the copies of these reports furnished, management believes that the directors, executive officers and greater than 10% stockholders complied with these requirements in a timely manner during the fiscal year 2016.2018 with the exception of one gift by Mr. Perez de la Mesa from a prior year that was reported on a Form 5.
REPORT OF THE AUDIT COMMITTEE
OF THE BOARD OF DIRECTORS OF POOL CORPORATION
FOR THE YEAR ENDED DECEMBER 31, 20162018
The Audit Committee reviews the Company’s accounting and financial reporting process on behalf of the Board. Management has the primary responsibility for the financial statements and the reporting process, including the system of internal controls over financial reporting.
In this context, the Audit Committee has met and held discussions with management, the Company’s internal auditors and the Company’s independent registered public accounting firm. Management represented to the Audit Committee that the Company’s audited financial statements were prepared in accordance with generally accepted accounting principles. The Audit Committee has reviewed and discussed the audited financial statements with management and the Company’s independent registered public accounting firm. The Audit Committee discussed with the independent registered public accounting firm those matters required to be discussed by Auditing Standard No. 1301 (formerly Auditing Standard No. 16) - Communications with Audit Committees and Auditing Standard No. 2410 (formerly Auditing Standard No. 18) - Related Parties.
In addition, the Audit Committee has discussed with the Company’s independent registered public accounting firm the firm’s independence from the Company and management and has received the written disclosures and letter from the Company’s independent registered public accounting firm required by applicable requirements of the Public Company Accounting Oversight Board regarding the independent accountant’s communications with the Audit Committee concerning independence.
The Audit Committee has discussed with the Company’s internal auditors and independent registered public accounting firm the overall scope and plans for their respective audits. The Audit Committee has met with the internal auditors and the independent registered public accounting firm, with and without management present, to discuss the results of their examinations, their evaluations of the Company’s internal controls and the overall quality of the Company’s financial reporting.
In reliance on the reviews and discussions referred to above, the Audit Committee recommended to the Board, and the Board has approved, that the audited financial statements be included in the Company’s Annual Report on Form 10-K for the year ended December 31, 2016,2018, for filing with the SEC. The Audit Committee has also approved the selection of the Company’s independent registered public accounting firm for the 20172019 fiscal year.
AUDIT COMMITTEE
Timothy M. Graven, Chairman
Robert C. Sledd
John E. Stokely
David G. Whalen
The Audit Committee Report set forth above shall not be deemed incorporated by reference by any general statement incorporating by reference this Proxy Statement into any filing under the Securities Act of 1933 or under the Exchange Act, except to the extent that we specifically incorporate this information by reference, and shall not be deemed filed under such Acts.
PROPOSAL TO RATIFY THE RETENTION OF INDEPENDENT REGISTERED PUBLIC ACCOUNTING FIRM
(Proposal 2)
The Audit Committee has approved the retention of Ernst & Young LLP (EY) as the Company’s independent registered public accounting firm for the fiscal year ending December 31, 2017,2019, and recommends the ratification of such retention by the stockholders. The Audit Committee reviews the performance of the independent registered public accounting firm annually. If the stockholders do not ratify the selection of EY, the Audit Committee will reconsider the selection. Even if our stockholders ratify the appointment, the Audit Committee, may, in its discretion, select a different independent auditor at any time during the year if it determines that such a change would be in the best interest of the Company and our stockholders.
Representatives of EY are expected to be present at the Annual Meeting, with the opportunity to make any statement they desire at that time, and will be available to respond to appropriate questions.
The affirmative vote of the holders of a majority of the shares of Common Stock present in person or by proxy at the Annual Meeting and entitled to vote is required for ratification of the retention of EY as the Company’s independent registered public accounting firm.
The Board of Directors unanimously recommends that our stockholders vote FOR the ratification of the retention of EY as our independent registered public accounting firm for fiscal year 2017.2019.
Fees Paid to Independent Registered Public Accounting Firm
The following table presents fees for professional audit services rendered by EY for the audit of the Company’s annual financial statements for the years ended December 31, 20162018 and 2015,2017, and fees billed for other services rendered by EY.
| | | | | | | | | | | | | |
| | | 2016 | | 2015 | | 2018 | | 2017 |
Audit fees (1) | | $ | 1,024,000 |
| | $ | 940,731 |
| | $ | 1,220,698 |
| | $ | 1,192,000 |
|
| Audit-related fees | | — |
| | — |
| | — |
| | — |
|
| Tax fees | | — |
| | — |
| |
Tax fees (2) | | | 43,492 |
| | 29,892 |
|
| Total | | $ | 1,024,000 |
| | $ | 940,731 |
| | $ | 1,264,190 |
| | $ | 1,221,892 |
|
| |
(1) | Audit fees pertain to the audit of the financial statements included in our Annual Report on Form 10‑K, the audit of our internal control over financial reporting and the review of the financial statements included in our Quarterly Reports on Form 10‑Q and, in 2016,Q. Audit fees for both years also include services for the reviewstatutory audits of certain of our Registration Statement on Form S-8.international operations. |
| |
(2) | Tax fees relate to employment tax advisory services billed in 2018 and 2017 and franchise tax advisory services billed in 2018. |
The Audit Committee preapproves all audit and permissible non-audit services before such services begin. Mr. Graven, Audit Committee chairman, has the delegated authority to preapprove such services and these preapproval decisions are presented to the full Audit Committee at the next scheduled meeting. During fiscal years 20162018 and 2015,2017, the Audit Committee and/or the Audit Committee chairman preapproved 100% of the services performed by EY. A copy of our Procedure for Preapproval of Services by our Independent Audit Firm is posted on our website at www.poolcorp.com.
ADVISORY VOTE TO APPROVE NAMED EXECUTIVE OFFICER COMPENSATION
(Proposal 3)
We are asking stockholders to vote to approve, on an advisory (nonbinding) basis, the compensation of our Named Executive Officers (NEOs) as disclosed in this proxy statement in accordance with the SEC’s rules. As described above in detail under the headings “Compensation Discussion and Analysis” and “Executive Compensation,” our executive compensation programs are designed to attract, motivate and retain our NEOs in a way that rewards performance and is aligned with our stockholders’ long-term interests. We believe that our executive compensation program reflects an overall pay-for-performance culture, which is strongly aligned with the long-term interests of our stockholders. In 2016,2018, we realized 20%23% growth in adjusted diluted earnings per share over 2015.2017. Our total stockholder return over the prior 1, 3, 5, and 10 year periods was 30.6%16.0%, 84.7%89.4%, 261.2%166.3% and 184.1%778.0%, respectively.
By design, our compensation is significantly more performance-weighted than the market, which we believe more closely aligns executive management’s interests with our stockholders, such that above market stockholder returns correlate with above market compensation and below market stockholder returns correlate with below market compensation. In this regard, the primary fixed component of compensation, base salary, is below market for our NEOs. As noted previously, our chief executive officer’s base salary represents 60%62% of the median salary of our peer group and our other NEOs’ salaries represent on average 65%77% of the median of peer group salaries.
The annual objectives under our annual cash award program are designed to be challenging and encompass improvement over the status quo with earnings per share being the single most important objective for most of our NEOs.
At our 20162018 annual meeting of stockholders, our stockholders overwhelmingly approved our executive compensation by approximately 98%99.4%. The final votes were as follows:
| | Number of Shares | | For | | Against | | Abstain | | Broker Non-Votes | | Against | | Abstain | | Broker Non-Votes |
| 35,766,756 | | 646,597 | | 92,092 | | 2,829,492 | |
| 35,909,667 | | | 188,358 | | 40,064 | | 2,125,791 |
We believe that performance-based compensation with annual, medium-term and long-term components serve to align executive interests with long-term stockholder interests while mitigating the motivation to take undue risk in the management of the business.
We are asking stockholders to vote on the following resolution:
RESOLVED, that the compensation paid to the Named Executive Officers as disclosed in the proxy statement for the Company’s 20172019 annual meeting of stockholders pursuant to Item 402 of Regulation S-K of the rules of the Securities and Exchange Commission is hereby APPROVED.
This vote is not intended to address any specific item of compensation, but rather the overall compensation of our NEOs and the philosophy, policies and practices described in this proxy statement.
The vote on this proposal is advisory, and therefore not binding on the Board or the Company. However, the Board will review the voting results and take them into consideration when making future decisions regarding executive compensation.
The Board of Directors unanimously recommends that our stockholders vote to approve the compensation of our Named Executive Officers as disclosed in this Proxy Statement by voting FOR this say-on-pay proposal.
ADVISORY VOTE ON THE FREQUENCY OF AN ADVISORY VOTE TO APPROVE
NAMED EXECUTIVE OFFICER COMPENSATION
(Proposal 4)
In accordance with the Dodd-Frank Act, we are also asking stockholders to vote, on an advisory basis, on how often we should seek an advisory vote on Named Executive Officer (NEO) compensation. When this advisory vote was last held in 2011, our stockholders indicated a preference to hold the advisory vote to approve NEO compensation every year and the Board implemented this standard.
The Board continues to believe that an annual advisory vote to approve NEO compensation is the most appropriate policy for our stockholders and the Company at this time. Although we recognize the potential benefits of having less frequent advisory votes to approve NEO compensation, we understand that an annual advisory vote is currently the standard desired by many stockholders.
Regardless of the frequency of the advisory vote to approve NEO compensation, the Compensation Committee will remain committed to considering feedback from stockholders as we continue to refine and evaluate the Company’s compensation programs.
While the Board recommends an advisory vote every year to approve NEO compensation, the voting options are to hold the advisory vote to approve NEO compensation every year, every two years or every three years. Stockholders may also abstain from voting on this proposal.
The vote on this proposal is advisory, and therefore not binding on the Board or the Company. However, the Board will review voting results and take them into consideration when making future decisions regarding the frequency of our say-on-pay vote.
The Board of Directors unanimously recommends that our stockholders vote to hold the say-on-pay vote EVERY YEAR.
STOCKHOLDER PROPOSALS AND BOARD NOMINATIONS
To be considered for inclusion in the proxy materials related to our 20182020 annual meeting of stockholders, we must receive stockholder proposals no later than November 29, 2017.28, 2019. If such proposal is timely received and in compliance with all of the requirements of Rule 14a-8 under the Exchange Act, it will be included in the proxy statement and set forth on the form of proxy issued for such annual meeting of stockholders.
Our Bylaws also require that any stockholder who desires to nominate a director or present a proposal before the 20182020 annual meeting must notify the Company’s corporate secretary no earlier than July 2, 20171, 2019 and no later than November 29, 2017.28, 2019.
By Order of the Board of Directors,
Jennifer M. Neil
Corporate Secretary
Covington, Louisiana
March 29, 201728, 2019
|
| |
| VOTE BY INTERNET – www.proxyvote.com Use the Internet to transmit your voting instructions and for electronic delivery of information up until 11:59 P.M. Eastern Time the day before the cut-off date or meeting date. Have your proxy card in hand when you access the web site and follow the instructions to obtain your records and to create an electronic voting instruction form. |
POOL CORPORATION 109 NORTHPARK BLVD. COVINGTON LA 70433 | ELECTRONIC DELIVERY OF FUTURE PROXY MATERIALS If you would like to reduce the costs incurred by our company in mailing proxy materials, you can consent to receiving all future proxy statements, proxy cards and annual reports electronically via e-mail or the Internet. To sign up for electronic delivery, please follow the instructions above to vote using the Internet and, when prompted, indicate that you agree to receive or access proxy materials electronically in future years.
|
| | VOTE BY PHONE - 1-800-690-6903 Use any touch-tone telephone to transmit your voting instructions up until 11:59 P.M. Eastern Time the day before the cut-off date or meeting date. Have your proxy card in hand when you call and then follow the instructions
|
| | VOTE BY MAIL Mark, sign and date your proxy card and return it in the postage-paid envelope we have provided or return it to Vote Processing, c/o Broadridge, 51 Mercedes Way, Edgewood, NY 11717.
|
|
| | | | | | | | | | | | | | | | | | | | |
| TO VOTE, MARK BLOCKS BELOW IN BLUE OR BLACK INK AS FOLLOWS: | | |
| | | |
THIS PROXY CARD IS VALID ONLY WHEN SIGNED AND DATED. |
| POOL CORPORATION | | | | | |
| | | | | | | |
| | The Board of Directors recommends that you vote FOR the following proposals: | | |
| | 1. | Election of Directors | For | Against | Abstain | | | | | |
| | | Nominees: | | | | | | | | |
| | | 1a. Andrew W. Code | o | o | o | | | For | Against | Abstain |
| | | 1b. Timothy M. Graven | o | o | o | 2.
| Ratification of the retention of Ernst & Young LLP, certified public accountants, as our independent registered public accounting firm for the 20172019 fiscal year. | o | o | o |
| | | 1c. Manuel J. Perez de la MesaDebra S. Oler | o | o | o | 3.
| Say-on-pay vote: Advisory vote to approve executive compensation as disclosed in the proxy statement. | o | o | o |
| | | 1d. Manuel J. Perez de la Mesa | o | o | o | Note: Such other business as may properly come before the meeting or any adjournment thereof. | | |
| | 1e. Harlan F. Seymour | o | o | o | | | | | |
| | | 1e.1f. Robert C. Sledd | o | o | o | The Board of Directors recommends you vote for Every Year on the following proposal: | Every
Year
| Every
Two
Years
| Every
Three
Years
| Abstain |
| | | 1f.1g. John E. Stokely | o | o | o | 4. | Frequency Vote: Advisory vote on the frequency of future Say-on-pay votes. | o | o | o | o |
| | | 1g.1h. David G. Whalen | o | o | o | | | | | |
| | | | | | Note: Such other business as may properly come before the meeting or any adjournment thereof
| | |
| | | | | |
| | Please sign exactly as your name(s) appear(s) hereon. When signing as attorney, executor, administrator, or other fiduciary, please give full title as such. Joint owners should each sign personally. All holders must sign. If a corporation or partnership, please sign in full corporate or partnership name, by authorized officer
| | | |
| | | | | | | | |
| | | | | | | | |
| | Signature [PLEASE SIGN WITHIN BOX] | Date | Signature (Joint Owners) | | Date | |
Important Notice Regarding the Availability of Proxy Materials for the Annual Meeting:
The Notice and Proxy Statement and Annual Report are available at www.proxyvote.com.
|
| | |
| | | |
| | | |
POOL CORPORATION
109 NORTHPARK BOULEVARD
COVINGTON, LOUISIANA 70433
THIS PROXY IS SOLICITED ON BEHALF OF THE BOARD OF DIRECTORS OF
POOL CORPORATION
The undersigned hereby appoints Jennifer M. Neil and Melanie M. Housey Hart, or either of them, as proxies, each with full power of substitution, and hereby authorizes each of them to represent and to vote, as designated on the reverse side, all shares of Common Stock of Pool Corporation (the “Company”) held of record by the undersigned on March 15, 2017,14, 2019, at the annual meeting of stockholders to be held at the Company’s headquarters at 109 Northpark Boulevard, Covington, Louisiana 70433, on May 2, 2017,1, 2019, or any adjournment or postponement thereof.
THIS PROXY, WHEN PROPERLY EXECUTED, WILL BE VOTED IN THE MANNER DIRECTED HEREIN BY THE UNDERSIGNED STOCKHOLDER. IF NO DIRECTIONS ARE GIVEN, THIS PROXY WILL BE VOTED
This proxy, when properly executed, will be voted in the manner directed herein by the undersigned stockholder. If no directions are given, this proxy will be voted FOR ALL OF THE DIRECTOR NOMINEES NAMED ON THE REVERSE SIDE,all of the director nominees named on the reverse side and FOR PROPOSALSproposals 2 AND 3, AND FOR EVERY YEAR FOR PROPOSAL 4. THE PROXY HOLDERS NAMED ABOVE WILL VOTE AS RECOMMENDED BY THE BOARD OF DIRECTORS ON ANY OTHER MATTER THAT MAY PROPERLY COME BEFORE THE MEETING.
and 3. The proxy holders named above will vote as recommended by the Board of Directors on any other matter that may properly come before the meeting.
Continued and to be signed on the reverse side
|
| |
| |
| |